Legend of 1-15 days forecast (Ensembles of GFS)
Ensemble consists 52 runs (or members) =1 operational run, 1 undisturbed
control run but with a resolution of twice as much as operational run, 50
slightly disturbed runs based on operational run but also with a resolution
of twice as much as the operational run.
Depicted are one control run and 10 slightly disturbed members.
Upper values are forecasted temperatures at 850 hPa in °C (left column)
Bold red line=30 years mean value
Bold green line = operational run
Bold blue line=control run
Bold grey line=mean value of the 11 depicted lines
Other colored thin lines=10 other (slightly disturbed) runs
Bottom values are forecasted amounts of precipitation in mm (right column)
Bold green line = operational run
Bold blue line=control run
Bold grey line=mean value of the 11 depicted lines
Other colored thin lines=10 other (slightly disturbed) runs
T850 hPa is useful for forecasting Tmax temperature by adding a certain
value (difference Tmax - T850 hPa) depending on season and amount of
cloud.
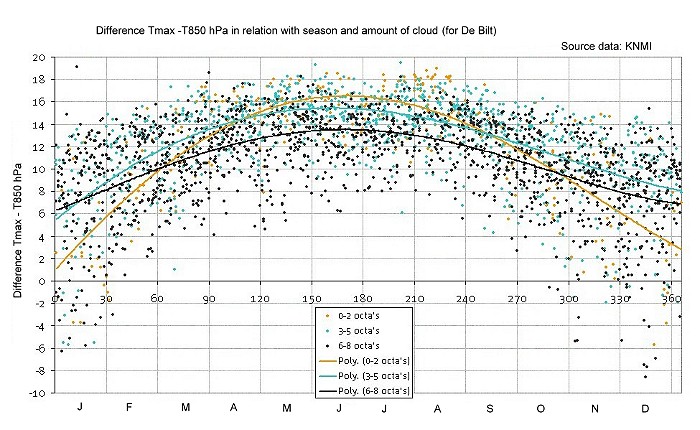
Source experimental diagram: Alwin Haklander
|