| Weather pictures & report of December 7 2012 |
| Snow related to occluded frontal system |
| Synopsis: at 500 hPa a ridge stretching from the Açores towards Iceland and a complex cold pool over Scandinavia - Mid Europe. A short wave trough moved from the United Kingdom towards the Low Countries. Belgium in a NW'ly flow of cold polar maritime air in which during the night and morning 6-7 December an occluded front slowly crossed Belgium from SW to NE. It halted over Mid Holland and came back to Belgium as very weak feature the following night. It produced during the morning hours of December 7 in Flanders 1-5 cm snow, but all or most of it melted away by the evening when the frost arrived. However over the Netherlands it produced 5-15 cm which lasted a couple of days. Pictures taken at Kampenhout. Hours in local time (CET). |
 |
|
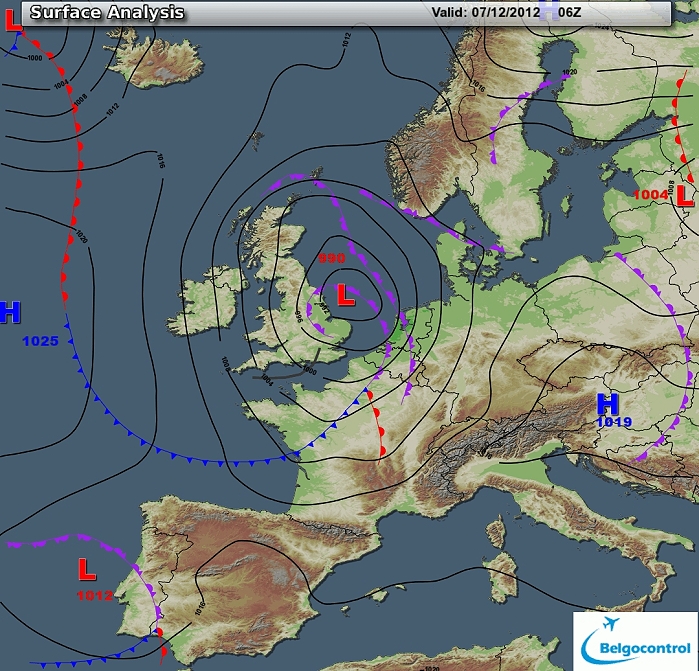
Surface analysis of December 7 2012 at 0700 CET. Low over
the North Sea with related occluding frontal systeme crossing Belgium
from southwest to northeast. (Source chart: Belgocontrol)
|
|
Loop of 12 surface analyses of December 7 2012 between 0100-1200 CET
with the weather plots showing the slow movement of the filling
depression with wintry precipitation falling with slightly
positive temperatures over the Low Countries. (Source: meteocentre.com)
|
 |
|
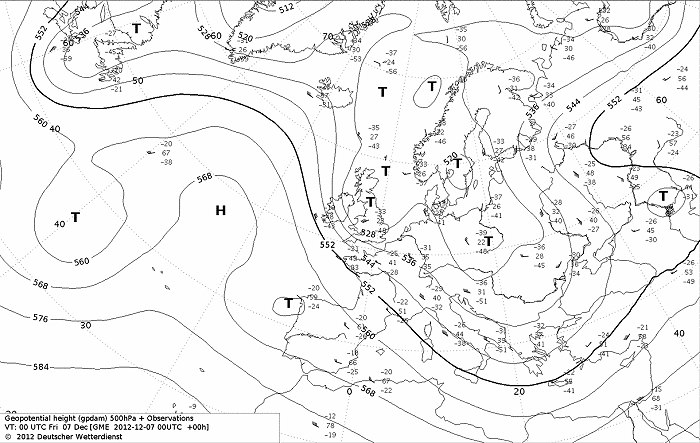
Upper air analysis 500 hPa of December 12 2012 at 0100 CET. A large cold
pool covering the entire northwest of Europe. A secondary cold pool /
short wave trough over United Kingdom was gliding southeast-wards. (Source chart: DWD via wetter3)
|
 |
|
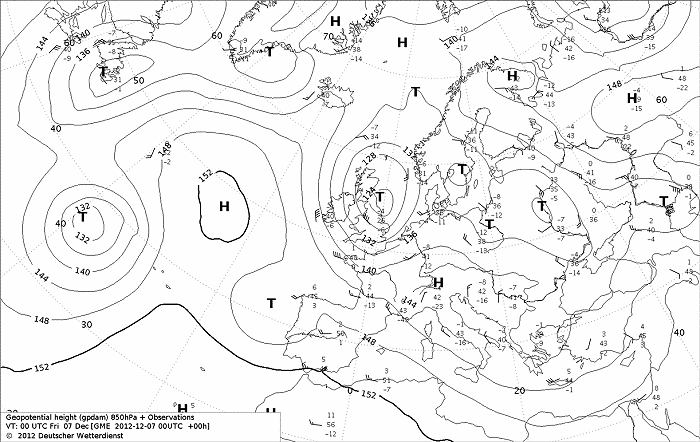
Upper air analysis 850 hPa of December 7 2012 at 0100 CET. Depression
recognizable east of Scotland which moved slowly to the Low Countries.
Isotherm of -8°C was initially overhead. (Source chart: DWD via wetter3)
|
 |
|
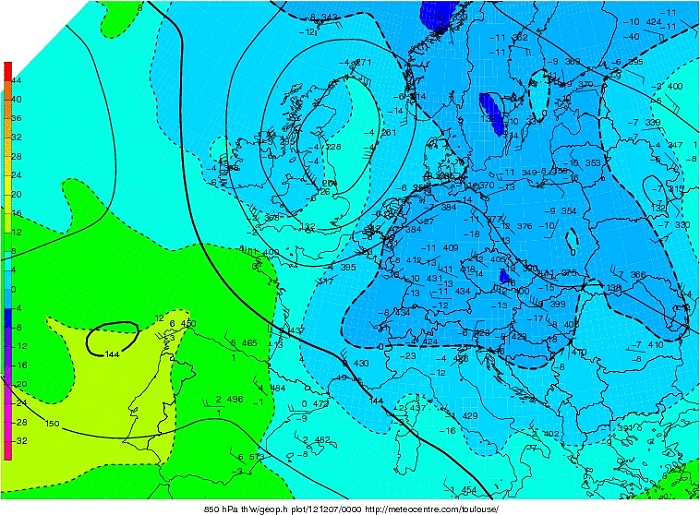
Upper air analysis Theta W 850 hPa of December 7 2012 at 0100 CET.
Rather cold air is replaced by somewhat milder air ahead the depression. (Source chart:
Meteocentre.com)
|
 |
|
Loop of forecasted soundings for Brussels of December 7 2012 between
0830-1900 CET. First hours all levels the temperature remained negative,
except the ground itself. But from 1100 CET onwards it became in the
lowest levels also slightly positive. (Source: RASP)
|
|
Another loop of forecasted soundings for Brussels for the next 27 hours
from December 6 2012
2300 CET onwards. Also here is visible that between noon en late
afternoon the temperature became just positive in the lowest levels. (Source: weatheronline.co.uk)
|
 |
|
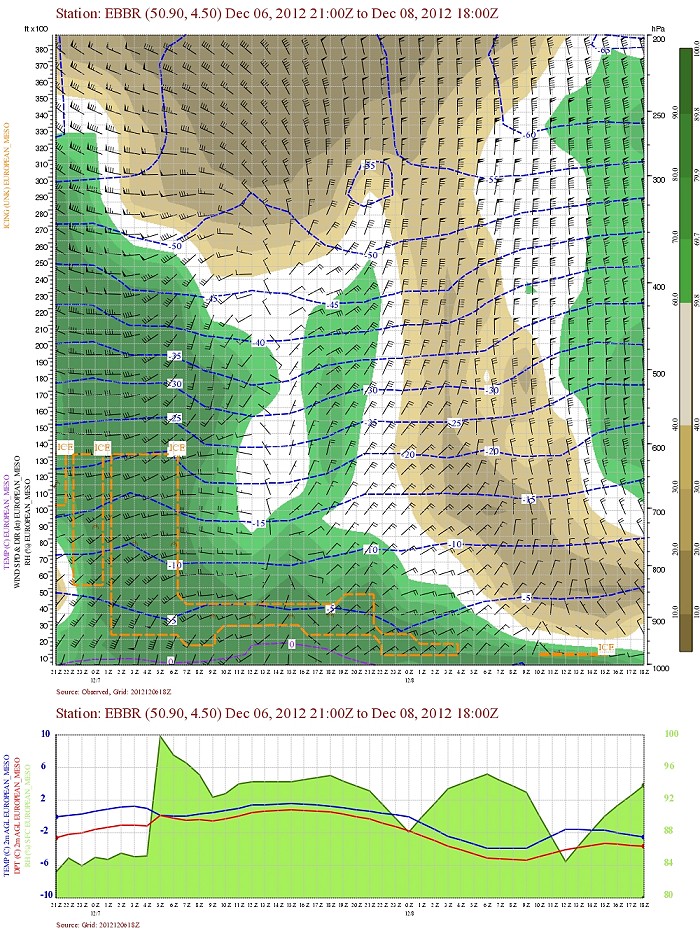
Forecasted vertical profile and surface temperature for Brussels of
December 6 2012 from
2100 UTC (=2200 CET) and the following 48 hours in steps of 1 hour. Legend of upper map: green-brown-white
is humidity in steps of 10% with darkest green being 90% or more, wind
in kt, temperatures each 5°C. During the night of 6-7 December
temperature did rise to 2°C, before descending to 0°C when most intense wintry
precipitation fell, afterwards again temporary rising to +2°C. (Source: Belgocontrol)
|
 |
|
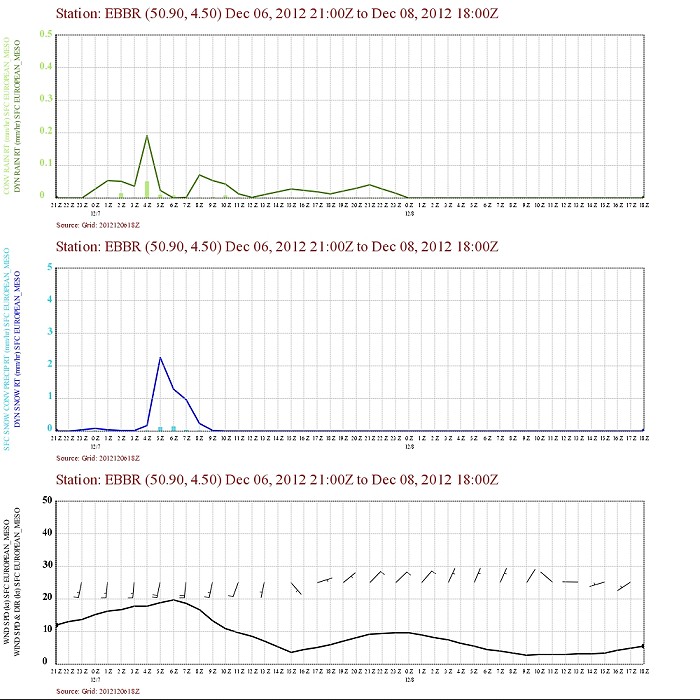
Corresponding precipitation and surface winds. Between 0600-0800 UTC
heaviest wintry precipitation with a slightly liquid form (wet snow). (Source: Belgocontrol)
|
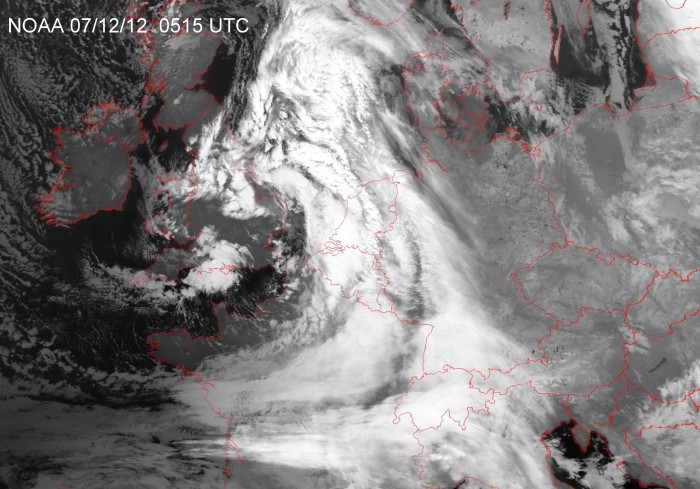 |
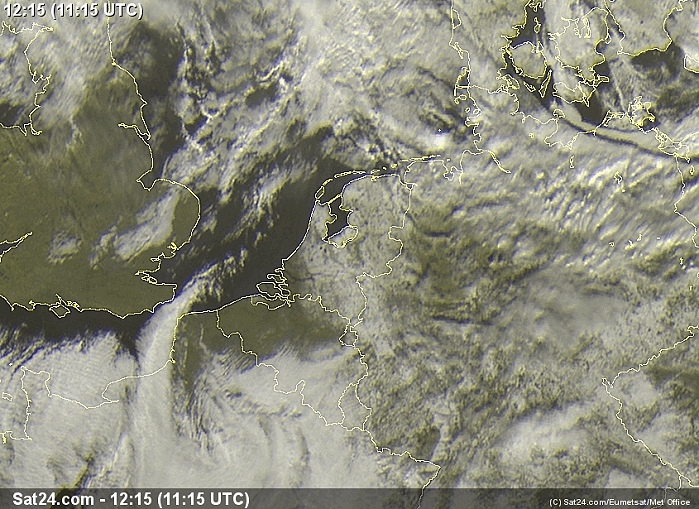
| 07/12/2012 0615 CET. Satellite picture (infra-red)
when the occlude front crossed the Low Countries. (Source sat picture: NOAA
and University of Bern)
|
Radar loop (reflectivity in dBZ) of December 6-7 2012 between 2100-1240 CET. Green colors represents moderate snow, blue colors is light snow. (Source radar picture: Belgocontrol).
|
Metars (hours in UTC) of Belgian airport EBBR. Translation: copy paste each obs via
metar-decoder |
 |
|
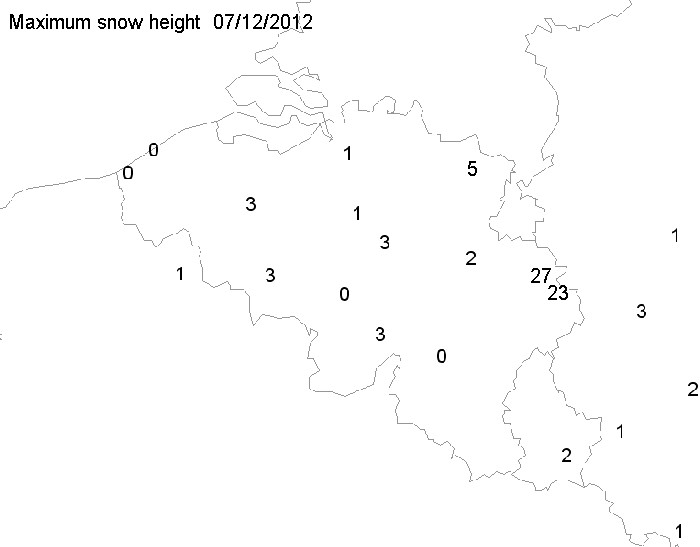
07/12/2012. Maximum snow height in cm taken from the synops of 0600,
0900 and 1200 UTC. Kleine Brogel on top in Flanders with 5 cm.
|
 |
|
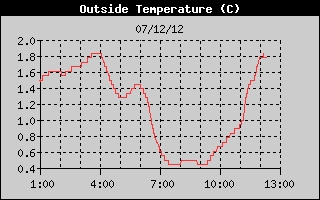
07/12/2012. Temperature histogram in degrees Celcius in local time (CET)
taken from an automatic station at Kampenhout with a minimal value of
+0,4°C between 0700-0900 CET when the heaviest wintry precipitation did
occur.
|
 |
|
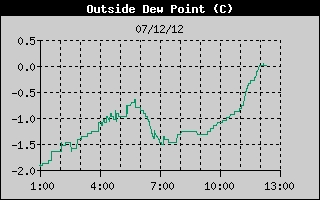
07/12/2012. Dewpoint temperature histogram in degrees Celcius in local time (CET)
taken from an automatic station at Kampenhout. It show that it was below
0°C thus solid wintry precipitation was possible which could accumulate.
|
 |
|
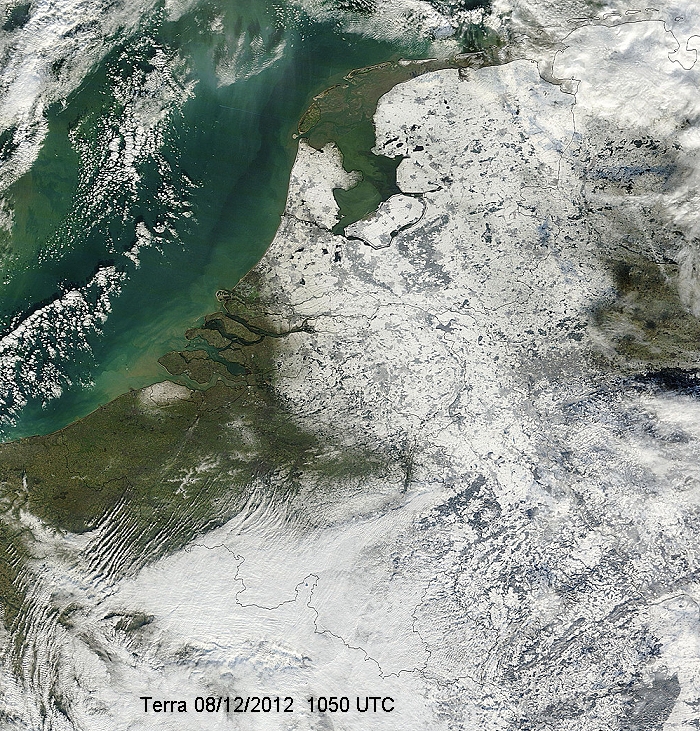
08/12/2012. The next day this satellite picture shows where over
the Low Countries still a snow cover was present. It seems that in Flanders only over the extreme northeast
something could be found, as in most parts of Holland. (Source satpicture: NOAA
and University of Bern)
|
 |
|
08/12/2012. A zoom over the Low Countries. A lot of cloudiness over the
Ardennes reveals sadly almost nothing. (Source: Image courtesy of MODIS Rapid Response Project at
NASA/GSFC)
|
 |
|
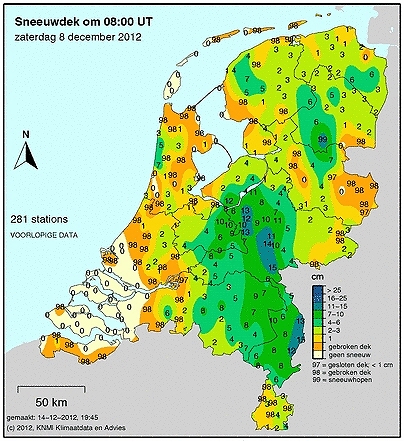
08/12/2012. Snow height in cm in the Netherlands taken at 0800 UTC. Nijmegen on top with 15
cm.
|
 |
|
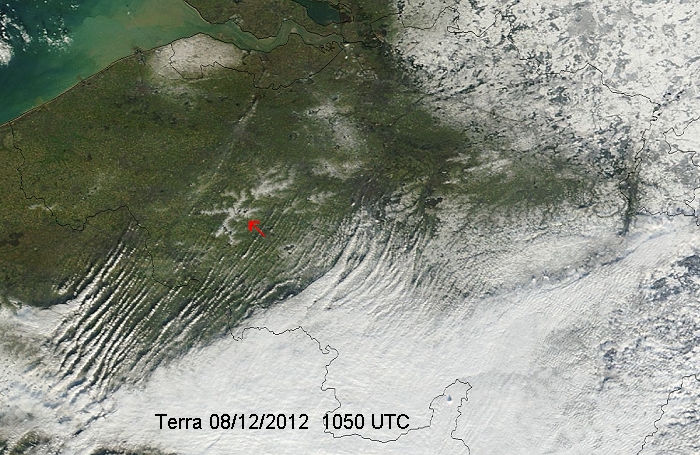
08/12/2012. A zoom over Flanders reveals that in the so called Flemish Ardennes (see
red arrow) with a height between 60 -145 meter above sea level, had more snow accumulation.
Not so surprisingly as snow did fall with sea
level temperatures between 0 and +1°C, and per 100 meter height
temperature normally drops by 1°C. (Source: Image courtesy of MODIS Rapid Response Project at
NASA/GSFC)
|
 |
|
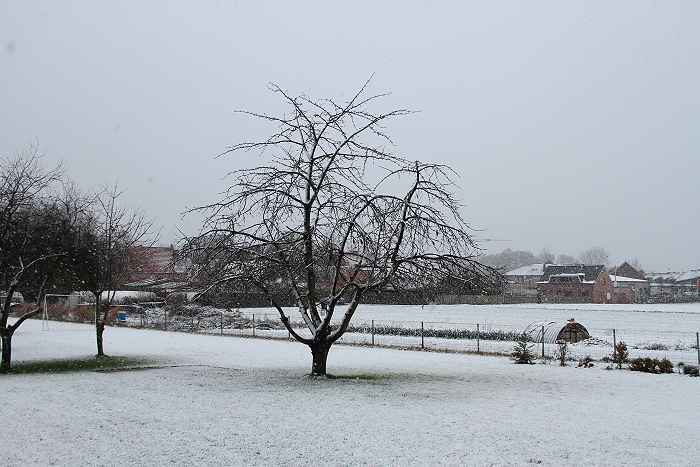
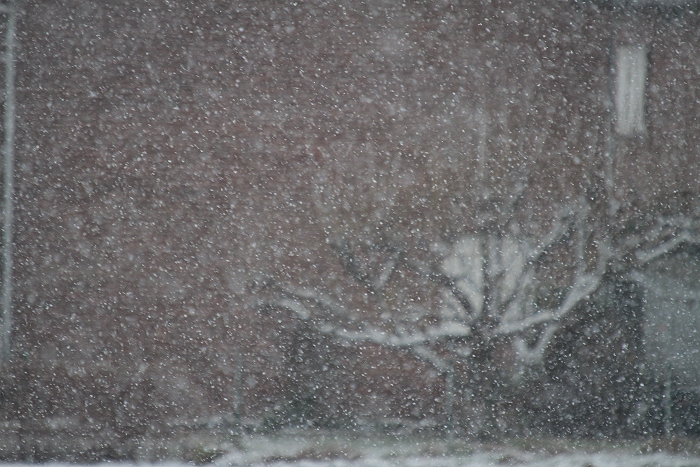
07/012/2012 1029 NW. After most of the snow eased off, a deposit
of between 1 and 2 cm was present.
|
 |
|
07/02/2012 1048 NNW. Bit later, a few light snow showers fell, but by the evening
nothing on the ground was left.
|