| Weather pictures & report of July 10 2010 |
| MCS (and supercell) thunderstorm along convergence line. |
| Synopsis: at 500 hPa, east of a relaxing trough west of the British Isles, our area in a weak SW'ly flow of warm and humid potentially unstable air. At surface passage of thermal depression, related convergence line reactivated due to diurnal heating enhancing the instability. From the evening on, formation of a MCS thunderstorm with the bulk of it passing over central Belgium resulting in a nice shelf cloud. Was also briefly preceded by a supercell over the north of province Limbourg. All pictures were taken at Kampenhout (central Belgium), hours in local time (CET). |
 |
|
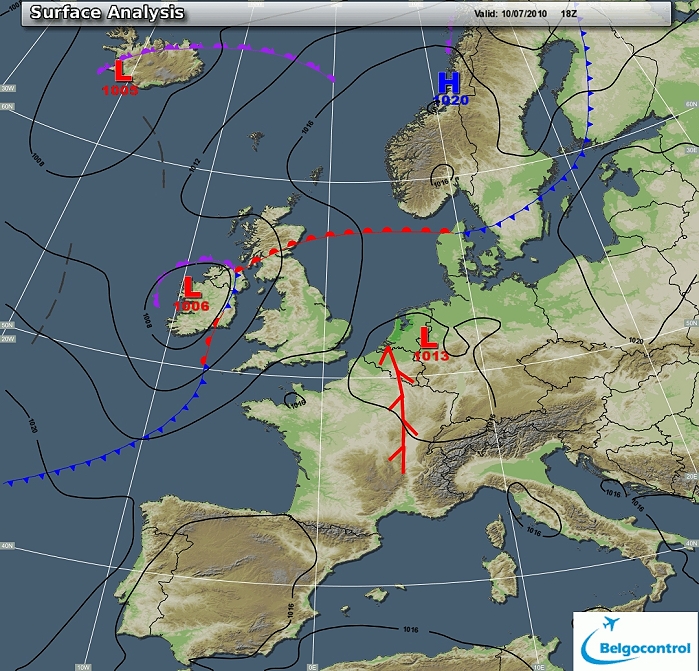
Surface analysis of July 10 2010 at 2000 CET. Related to a thermal
depression over eastern Benelux, a convergence crosses Belgium from SW to NE. (Source chart: Belgocontrol)
|
|
Loop of 11 surface analyses (of each hour between 1400 - 2400 CET) with
weather plots showing the slow movement of the thermal depression. (Source: meteocentre.com)
|
 |
|
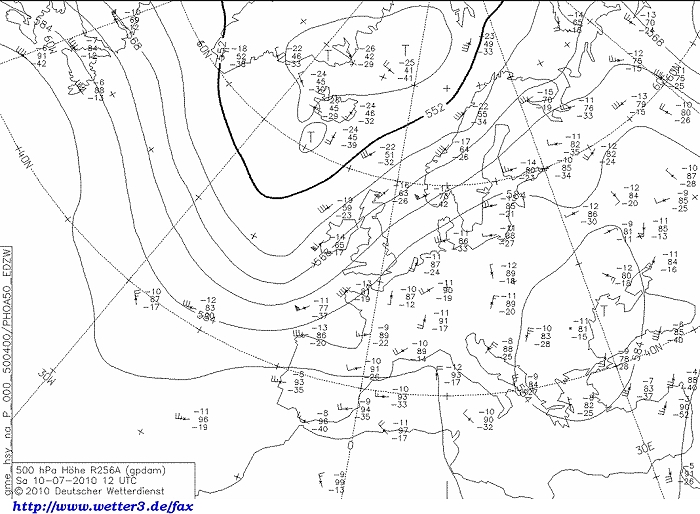
Upper air analysis 500 hPa of July 10 2010 at 1400 CET. Related to a
low between Iceland and Greenland, a long wave relaxing trough west of
the British Isles. On the other hand a collapsing high over Austria.
Our area in a weak SW'ly airflow. (Source chart: DWD via wetter3)
|
 |
|
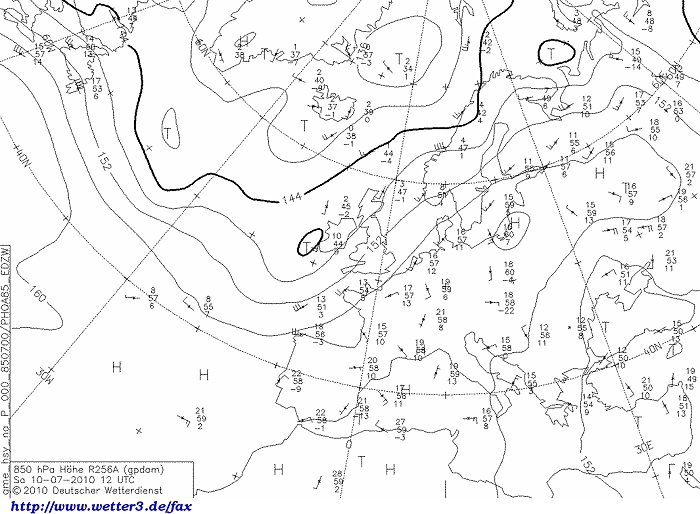
Upper air analysis 850 hPa of July 10 2010 at 1400 CET. Recognizable
overhead a weak SSW'ly flow of warm air with temperatures of around 17°C.
Extrapolating to the surface this leads inland to tropical temperatures
of >30°C (Source chart: DWD via wetter3)
|
 |
|
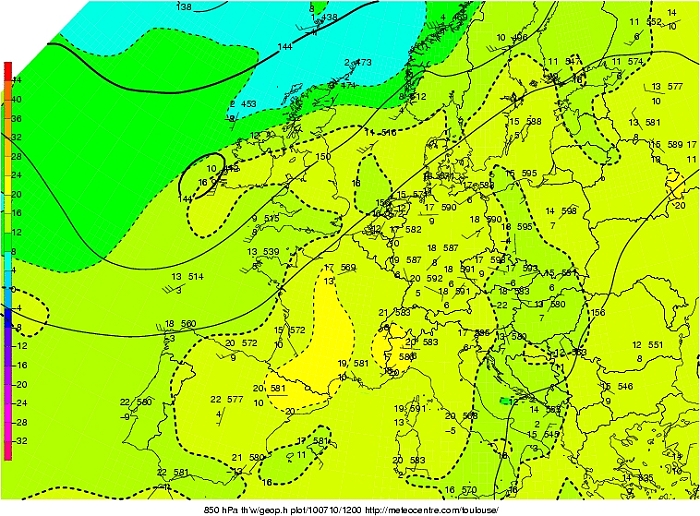
Upper air analysis of wetbulb temperatures 850 hPa of July 10 2010 at 1400 CET.
In a weak SSW'ly flow advection of warm and humid air with temperatures of around 17°C. (Source chart:
Meteocentre)
|
 |
|
Loop of forecasted soundings for Brussels of July 10 2010 between
0830-2000 CET. Unstable from 850 hPa upwards. Furthermore a weak low
level (0-3 km) and deep layer (0-6km) shear in wind speed, besides also
a rather weak shear in direction (SREH 0-3 km). Together with large CAPE this enhanced
the risk of
large multicells (MCS). (Source: RASP)
|
|
Another loop of forecasted soundings for a 15 hours period (in steps of
three hours) of Brussels from July 10 2010, 1100 CET onwards. Included
are some thunderstorms indices: surface based CAPE went up to around
2000 J/kg, KI 37, TT 54, LI -8 = moderate to strong convective potential
which may lead to scattered to numerous thunderstorms with few to scattered severe
thunderstorms. (Source: weatheronline.co.uk)
|
|
10/07/2010 1600-2130 CET. Satellite loop in the visual channel.
Initially some high-medium level cloudiness invaded Belgium which marked
the border of humid air. In this airmass a developing MCS over
Belgium moving to Holland. Ahead over Limbourg also the formation of a
supercell which splitted to a left and right mover, afterwards
amalgamating with the MCS. (Source sat
picture: Eumetsat via Sat24.com)
|
 |
|
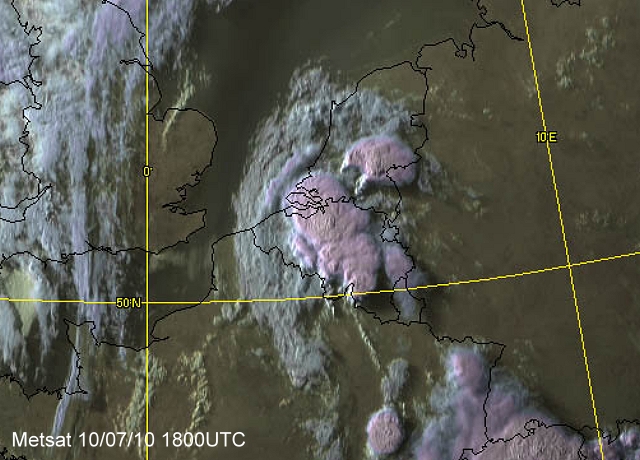
Still image in the visual channel giving a nice view on the MCS covering
3/4 of Belgium and the supercell of Holland which spitted in two
sections. (Source pic: Eumetsat via woksat.info)
|
 |
|
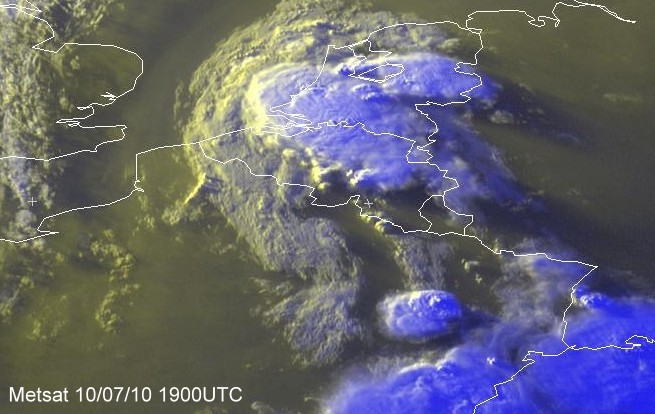
An hour later in the RGB channel with MCS covering
half of the Benelux. (Source pic: Eumetsat)
|
Radar loop (rainfall rate in mm/hr) of July 10-11 2010 between 1700-0050 CET. Over Limbourg clearly a supercell (with hook echo) later splitting. Reports on the field showed some wind damage in the small area where the hook echo crossed which supports that a weak tornado could have been (briefly) formed. Over the center of Belgium temporary the formation of an intense echo resulting in a rather huge shelf cloud which is described below with some pictures. Tops of precipitation went up 12 to 14 km. (Source radar picture: Belgocontrol)
|
Corresponding discharges of July 10 2010 between 2000-2400 CET. Affected area's were the center and later also the east of Belgium. The storm intensified rapidly over Holland. (Source lightning picture: Blids)
|
 |
|
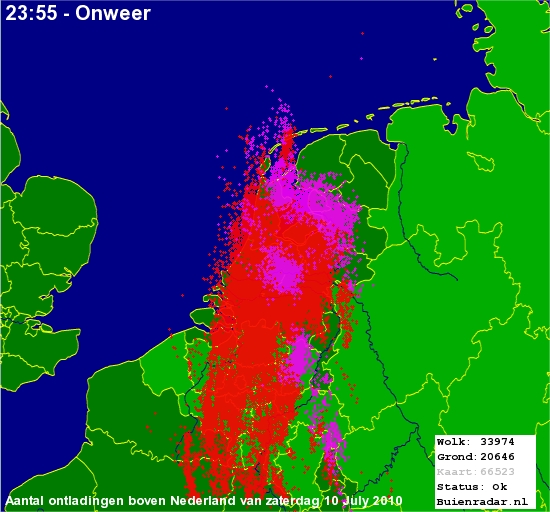
10/07/2010. 24 hour overview of the Benelux showing that the center of
Belgium was affected the most. (source picture: Buienradar)
|
Some metars (hours in UTC) of Brussels Airport (EBBR). Translation: copy paste each obs via metar-decoder
EBBR 101650Z 34009KT CAVOK 29/17 Q1015 NOSIG=
|
 |
|
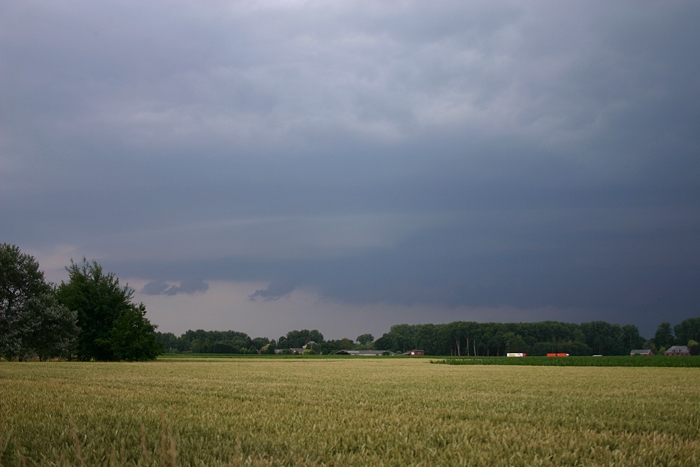
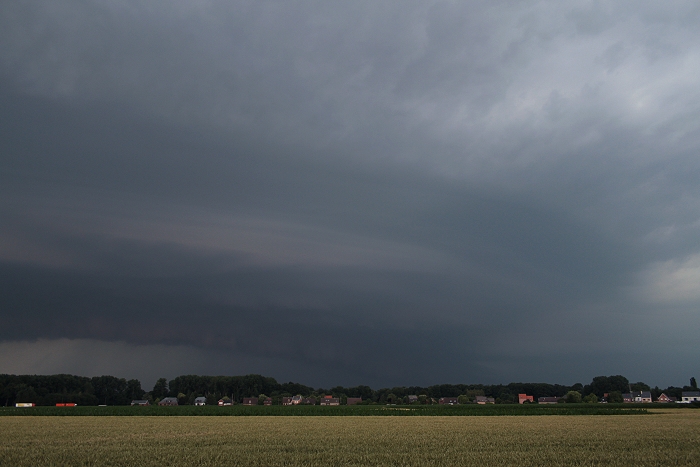
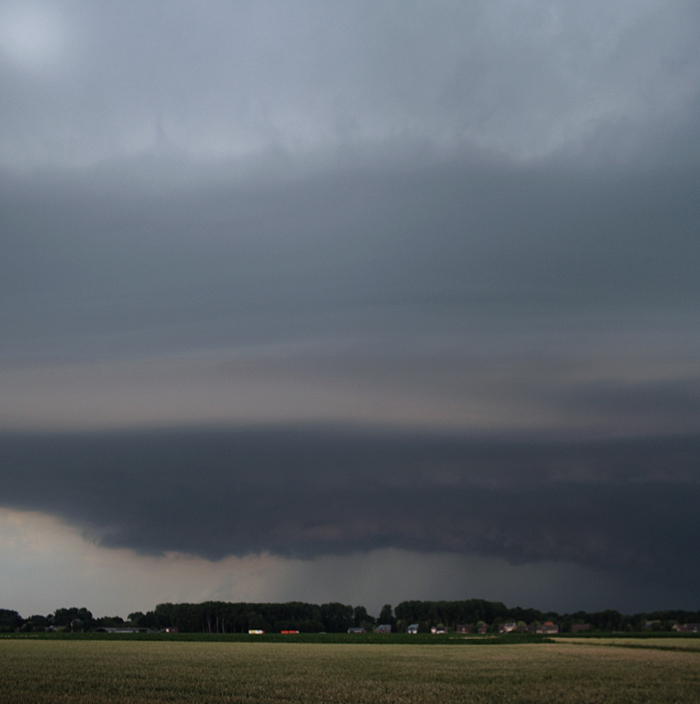
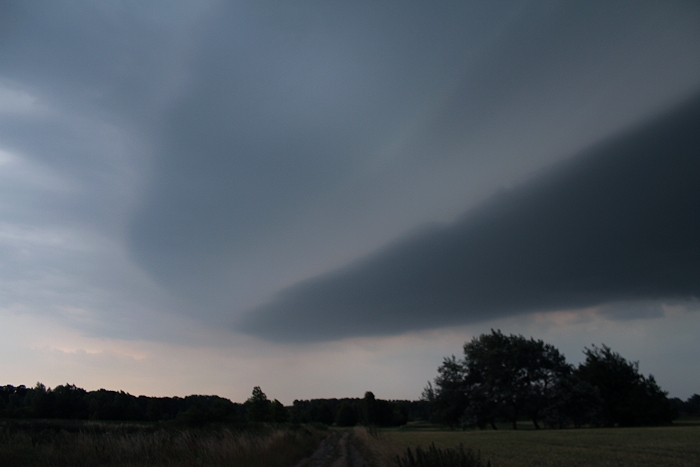
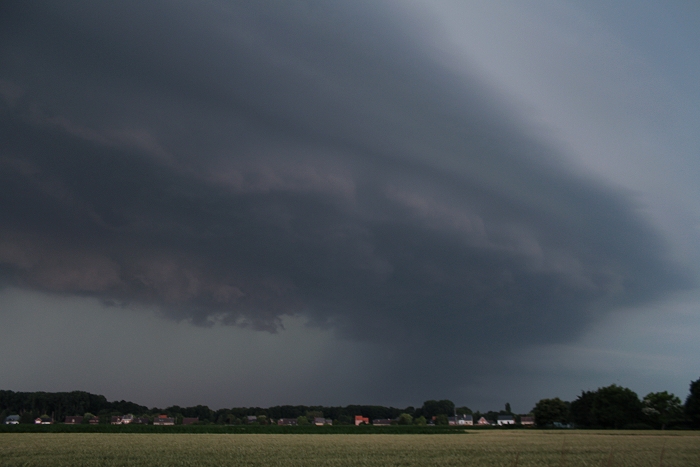
10/07/2010 1956 WSW. In a time frame of less than 15 minutes a rather
huge shelf rolled out, here the first signs on the southern flank
of the developing cell.
|
 |
|
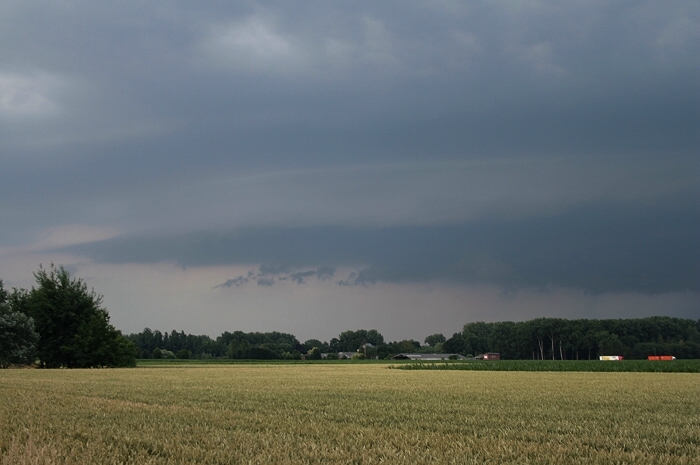
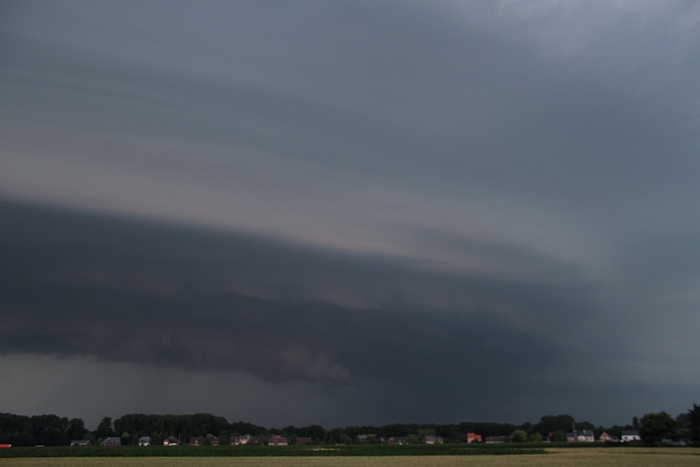
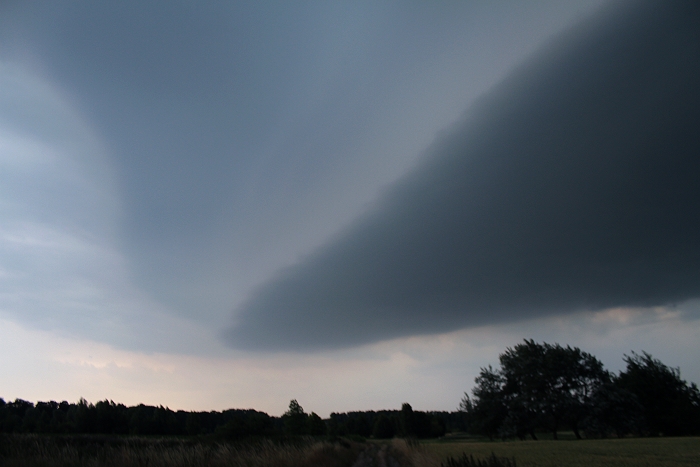
10/07/2010 1958 WSW. Bit later.
|
 |
|
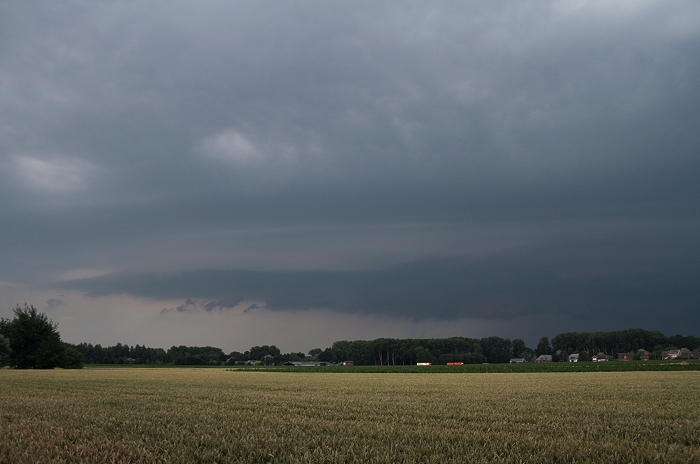
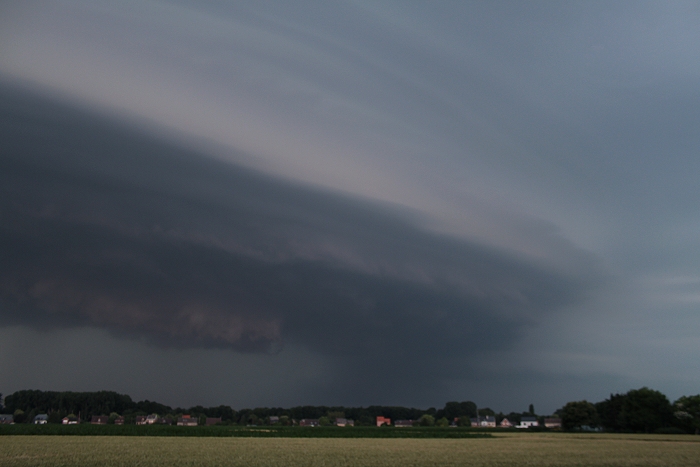
10/07/2010 1959 WSW. Wider view.
|
 |
|
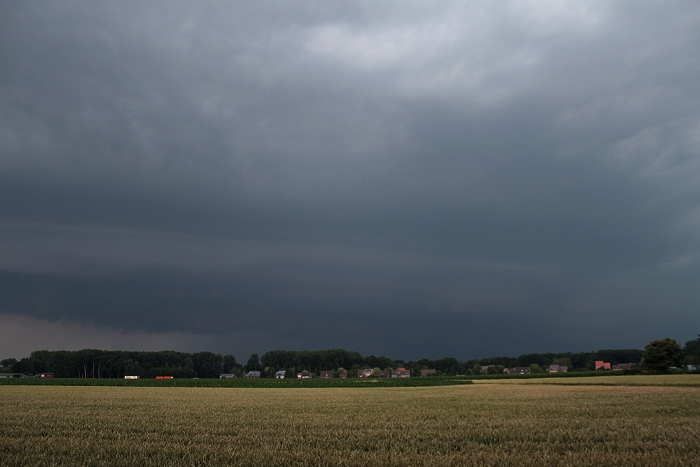
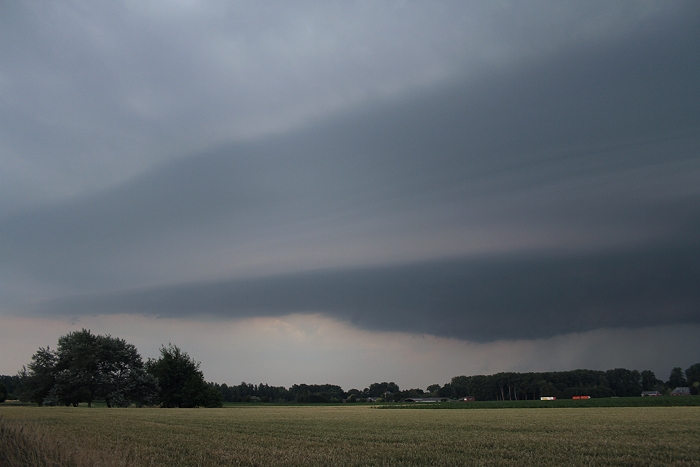
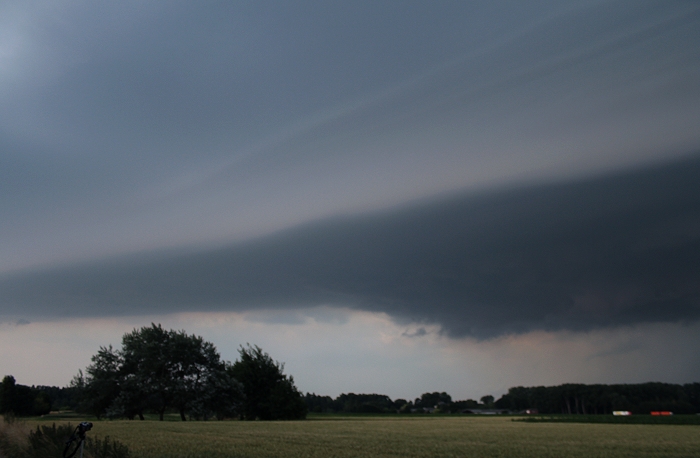
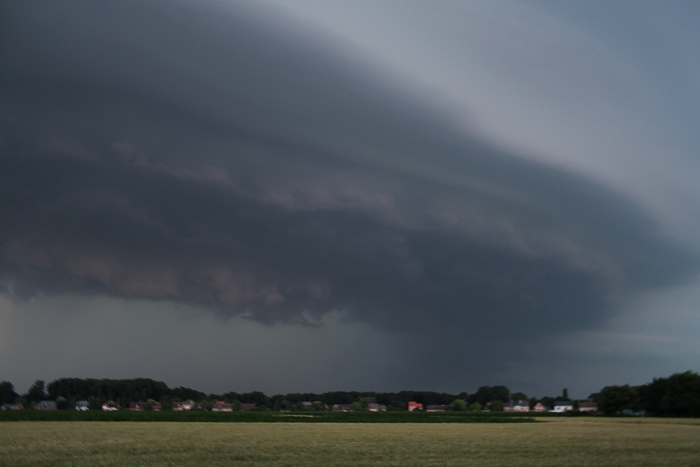
10/07/2010 1959 WNW. Northern flank.
|
 |
|
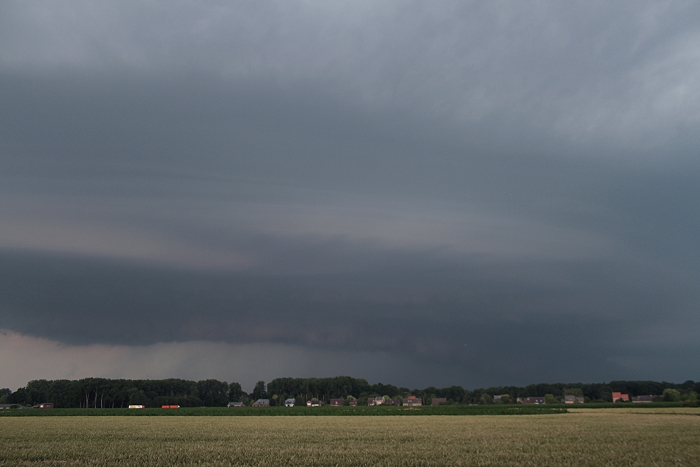
10/07/2010 2001 WNW. Northern flank a couple minutes later.
|
 |
|
10/07/2010 2002 WSW. Southern flank a minute later.
|
 |
|
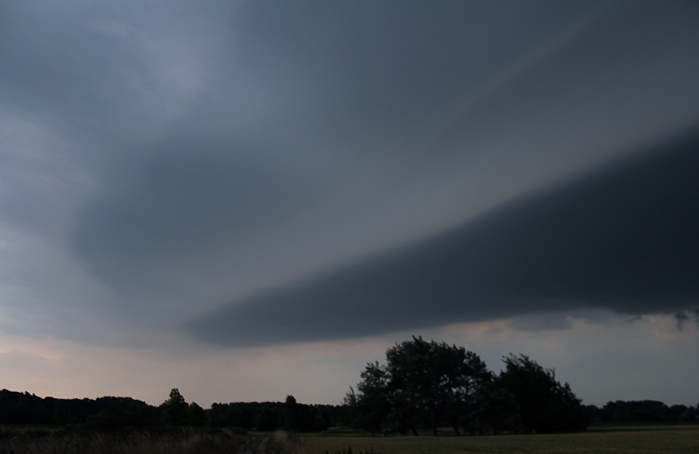
10/07/2010 2002 WNW. Northern flank same time.
|
 |
|
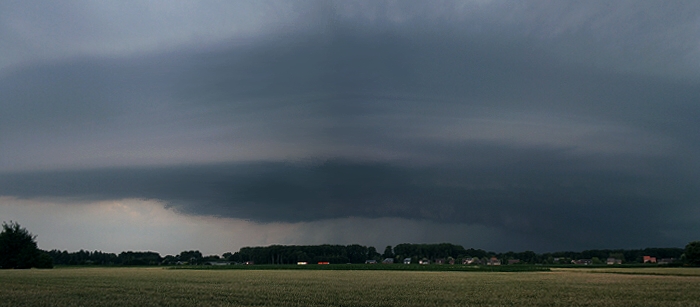
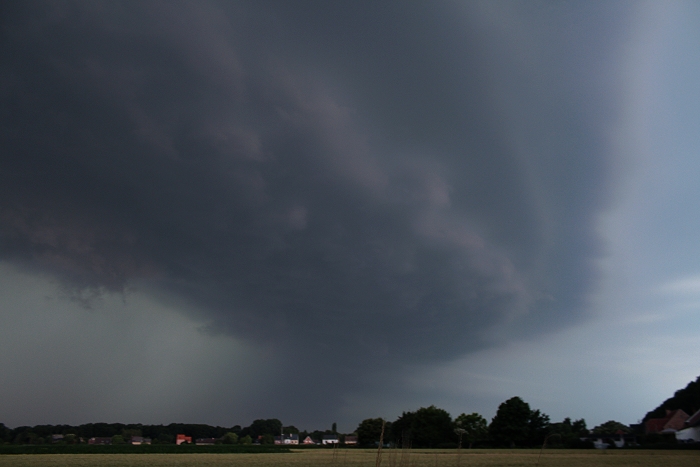
10/07/2010 2002 W. Central part panorama of two horizontal stitched
pictures.
|
 |
|
10/07/2010 2002 W. Central part panorama of two vertical stitched
pictures.
|
 |
|
10/07/2010 2004 WNW. Bit later northern flank.
|
 |
|
10/07/2010 2005 SW. Evolution southern flank.
|
 |
|
10/07/2010 2006 SW. One minute later.
|
 |
|
10/07/2010 2006 SSW.
|
 |
|
10/07/2010 2007 SSW.
|
 |
|
10/07/2010 2006 WNW. Evolution northern flank.
|
 |
|
10/07/2010 2007 WNW.
|
 |
|
10/07/2010 2007 WNW.
|
 |
|
10/07/2010 2009 WNW.
|
|
Time lapse between 1957-2010 CET with view to the west showing the approach
of a shelf cloud.
|
 |
|
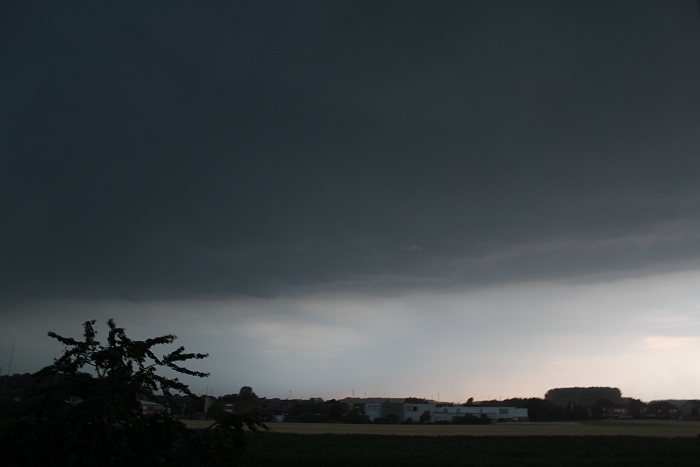
10/07/2010 2016 N. Shelf overhead, at that moment gusts of 35 kt, total
rain was12 mm.
|
 |
|
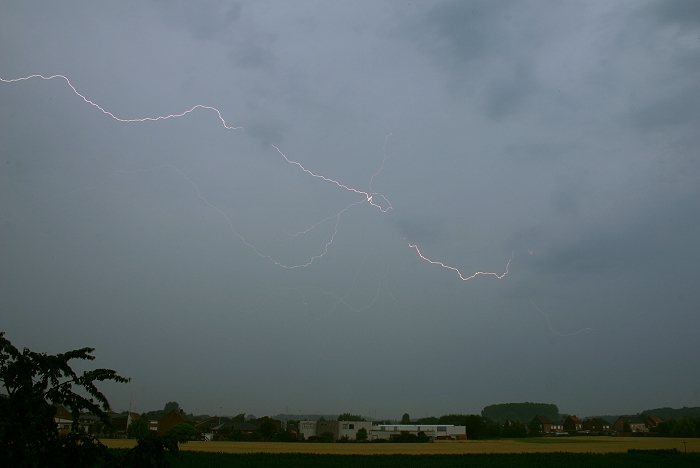
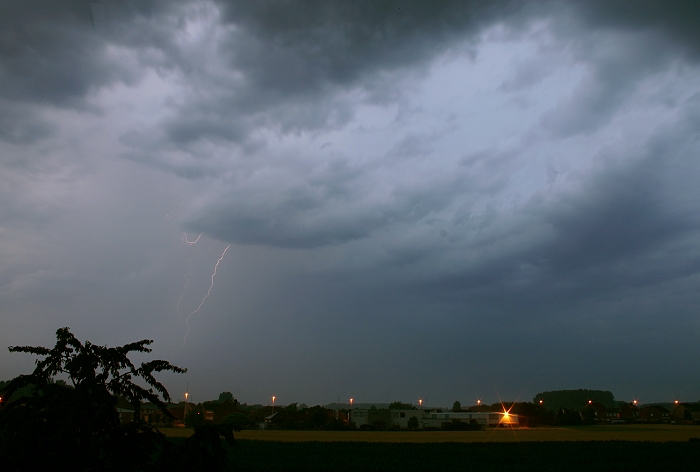
10/07/2010 2116 N. At the back of the storm, a few discharges could be
captured on the sensor.
|
 |
|
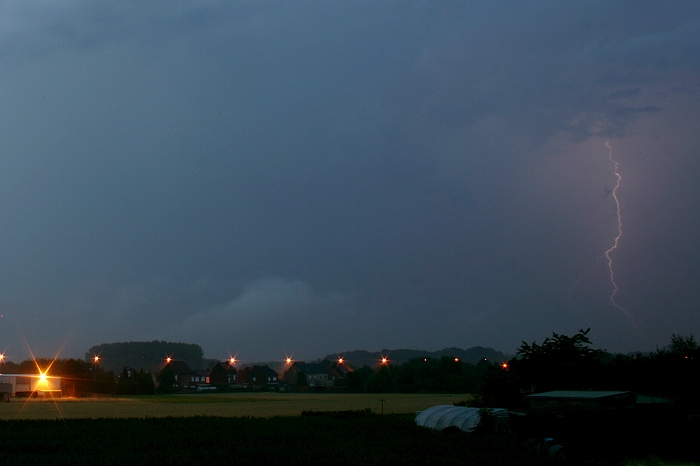
10/07/2010 2202 N. At the back also some smaller cells developed leading
to some discharges.
|
 |
|
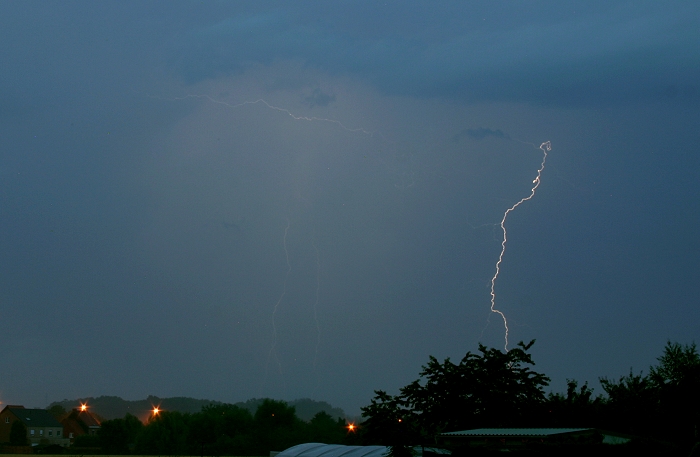
10/07/2010 2217 NNE.
|
 |
|
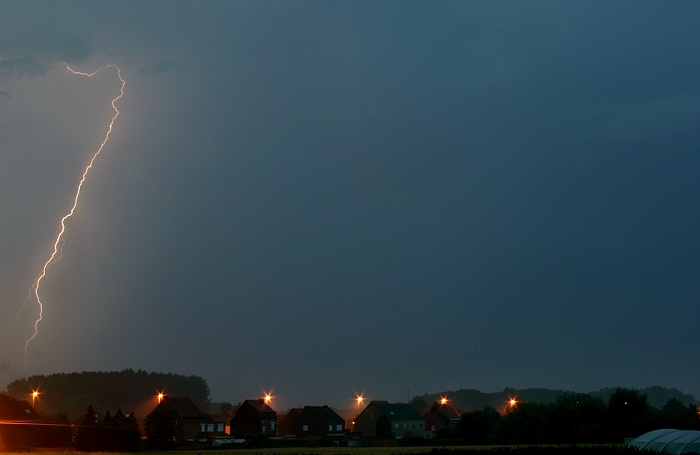
10/07/2010 2221 NE.
|
 |
|
10/07/2010 2224 NE.
|