SkyStef's weather page
|
|
SkyStef's weather page |
|
 Observations Observations Observations Observations |
| AnalysisAnalysis |
| Satellite picturesSatellite pictures |
| RadarRadar |
| LightningLightning |
| SoundingsSoundings |
| Belgian weather blogBelgian weather blog |
| Weather station KampenhoutWeather station Kampenhout |
| Webcam KampenhoutWebcam Kampenhout |
| Webcams BelgiumWebcams Belgium |
| Weather plotsWeather plots |
| TemperaturesTemperatures |
| WeatherWeather |
| WindWind |
| Snowdepth & seatemperaturesSnowdepth & seatemperatures |
| SurfaceSurface |
| Upper air 700-850 hPaUpper air 700-850 hPa |
| Upper air 400-500 hPaUpper air 400-500 hPa |
| Upper air 200-300 hPaUpper air 200-300 hPa |
| BeneluxBenelux |
| EuropeEurope |
| UKMO modelUKMO model |
| DWD modelDWD model |
| GFS modelGFS model |
| Surface pressure & weatherSurface pressure & weather |
| Upper air 500 hPaUpper air 500 hPa |
| Upper air 850 hPaUpper air 850 hPa |
| Upper air 700 hPaUpper air 700 hPa |
| Upper air 200 hPaUpper air 200 hPa |
| Upper air 300 hPaUpper air 300 hPa |
| PrecipitationPrecipitation |
| 2 m temperature2 m temperature |
| WindWind |
| Wind gustWind gust |
| Snow forecastSnow forecast |
| Thunderstorm forecastThunderstorm forecast |
| Aviation weatherAviation weather |
| Forecasted soundingsForecasted soundings |
| Meteogram BrusselsMeteogram Brussels |
| Interactive forecastInteractive forecast |
| Benelux weather in 1 clickBenelux weather in 1 click |
| Skystef's weersverwachting BelgiëSkystef's weersverwachting België |
| Precipitation and snow levelPrecipitation and snow level |
| Equivellent potential temperatureEquivellent potential temperature |
| DewpointDewpoint |
| Temperature 850 hPaTemperature 850 hPa |
| CAPE & LICAPE & LI |
| KO Index & vertical motionKO Index & vertical motion |
| Soaring Index & convective cloudsSoaring Index & convective clouds |
| Total-total IndexTotal-total Index |
| SRH (sfc-3000m)SRH (sfc-3000m) |
| Windchill calculatorWindchill calculator |
| Heat Index calculatorHeat Index calculator |
| Windspeed converterWindspeed converter |
| Convective windgust calculatorConvective windgust calculator |
| Fog calculatorFog calculator |
| Tmin calculatorTmin calculator |
| Wintry ppn calculatorWintry ppn calculator |
| Thunderstorm calculatorsThunderstorm calculators |
| METAR & TAF retrieverMETAR & TAF retriever |
| METAR decoderMETAR decoder |
| Forecasting tipsForecasting tips |
| Glossary of weather termsGlossary of weather terms |
| Weather imagesWeather images |
| Weather quizWeather quiz |
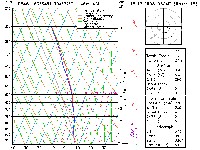
Forecasted soundings Belgium
(including thunderstorm indices)
|
| Legend Thick red line = atmosphere
sounding of temperature Thin red lines = dry adiabatic laps rate On right = wind barbs in knots
In box: K = K Index in °C
Thunderstorm forecasting Legend instability indices: K Index = thunderstorm potential Poor correlation between KI values and severe weather events, good correlation KI < 26 and no thunderstorms.
TT = coverage of thunderstorm Good correlation between TT values > 48 and severe weather events.
PW = measure type of supercell thunderstorm Poor correlation between PW values and severe weather events, good correlation PW < 1 and no thunderstorms.
LI = measure of severity of thunderstorm Good correlation between LI values < -5 and severe weather events.
CAPE = measure of severity of thunderstorm Poor correlation between CAPE values and severe weather events.
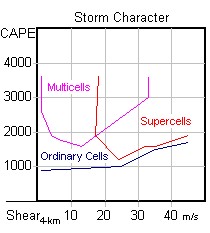
Combination CAPE and 0-4km speed shear can give a hint on thunderstorm type
CIN = is the negative area on a sounding found between
the lifting condensation level and level of free convection. EH = measure of rotation potential SREH = measure of rotation potential for (thunder)storms Poor correlation between SREH values and severe weather events.
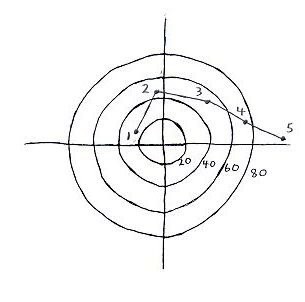
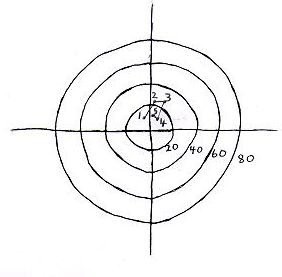
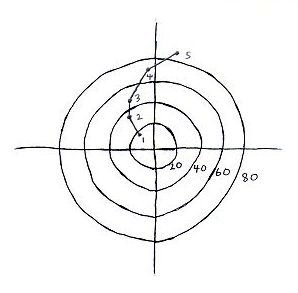
Hodograph: useful for evaluating vertical wind shear. Hodograph read as: 1=ESE 24kt @ 950hPa, 2=S 43kt @ 850 hPa, 3=SW 52kt @ 700 hPa, 4=WSW 77kt @ 500 hPa, 5=W 97kt @ 300hPa. (Check also the wind speed converter)
Types of hodographs and associated thunderstorms if they form: Weak speed shear and weak directional shear or weak speed shear and strong directional shear: single cell or pulse storm.
Strong speed shear and weak directional
shear: multicell thunderstorm.
Strong speed shear and strong
directional shear: supercell thunderstorm.
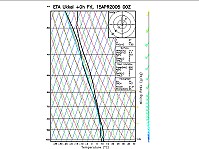
Hail forecasting One of the better indicators in forecasting hail is the zero degree level of the wet bulb temperature. To find the wet bulb construct a mean line between the curves of the temperature and dew point and find the level were it crosses the 0°C. Critical values for hail:
Snow forecasting One of the best indicators in forecasting solid precipitation (snow) is the zero degree level of the wet bulb temperature. To find the wet bulb construct a mean line between the curves of the
temperature and dew point and find the level were it crosses the 0°C.
|