| Weather pictures & report of December 16 2010 |
| Snow related to cold front. |
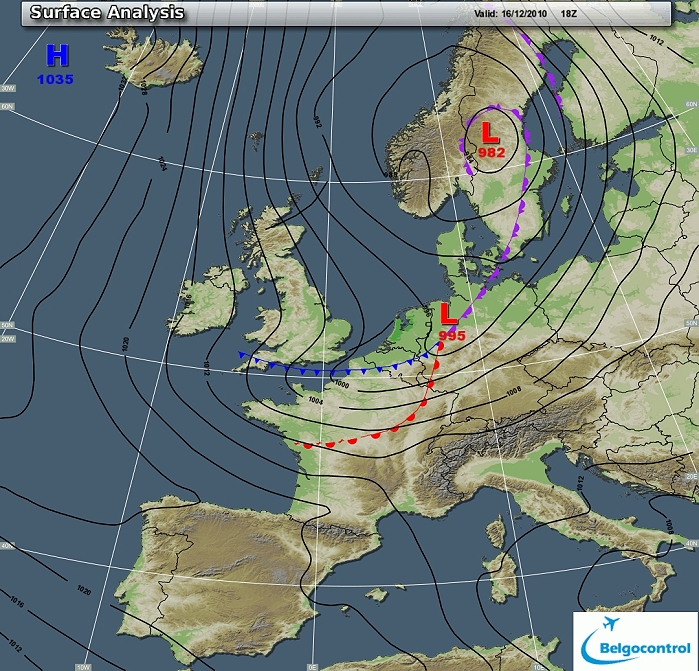
| Synopsis: at 500 hPa a ridge stretching from Greenland to the southern parts of the Atlantic Ocean and on the eastern side a sharpening trough west of Norway. Overhead in the NW'ly airflow the crossing of warm and cold front with on the latter precipitation transforming from liquid to solid form. It induced a couple cm of snow in most parts of Flanders and was the start of a second cold wave. All pictures of December 16 were taken at Kampenhout (central Belgium), on December 17 five km further southwestwards at Steenokkerzeel. Hours in local time (CET). |
 |
|
Surface analysis of December 16 2010 at 1900 CET. Cold front over the
centre of Belgium moving SE-wards. (Source chart: Belgocontrol)
|
|
Loop of 12 surface analyses of December 16 between 1300-2400 CET
with the weather plots. (Source: meteocentre.com)
|
 |
|
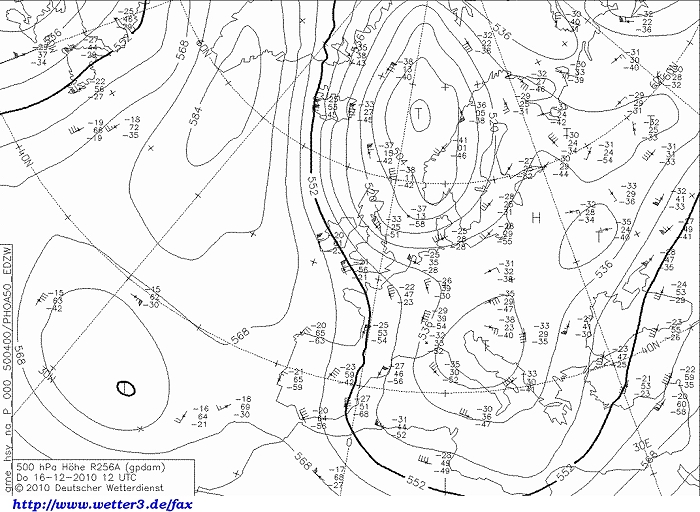
Upper air analysis 500 hPa of December 16 2010 at 1300 CET. Sharpening
trough (cold pool) west of Norway and Northsea plunging SSE-wards.
Within 12 hrs overhead temperatures descended from -25°C to -35°C. (Source chart: DWD via wetter3)
|
 |
|
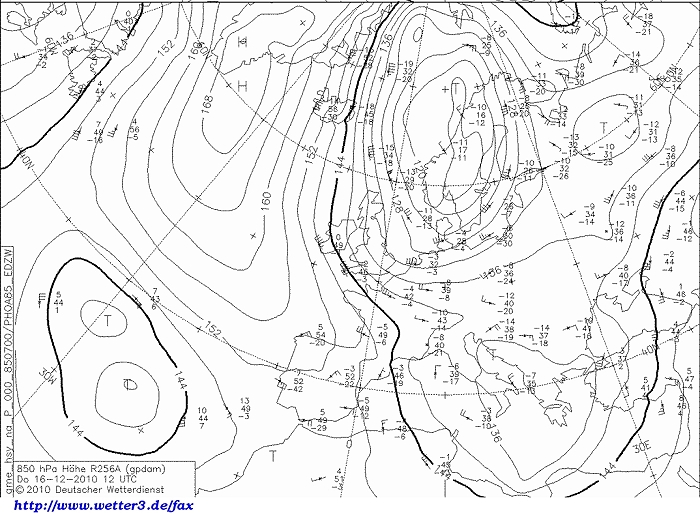
Upper air analysis 850 hPa of December 16 2010 at 1300 CET. In a NW'ly
flow, the minus 11 degrees was advected into our area during the evening. (Source chart: DWD via wetter3)
|
 |
|
Loop of forecasted soundings for Brussels of December 16 2010 between
0830-1900 CET. Around 1800 CET sudden veering winds advected negative
temperatures over the entire layer. (Source: RASP)
|
|
Another loop of forecasted soundings for Brussels between December 16 1300 CET and
December 17 1300 CET. Same wintry turn between 1600-1900 CET, afterwads staying
cold over the entire layer but gradually becoming dry. (Source: weatheronline.co.uk)
|
 |
|
16/12/2010 1745-1900 CET. Satellite loop in the infra-red channel.
Massive cloudiness related to the warm and cold front crossing the Low
Countries. (Source sat picture: Eumetsat via
Sat24.com)
|
 |
|
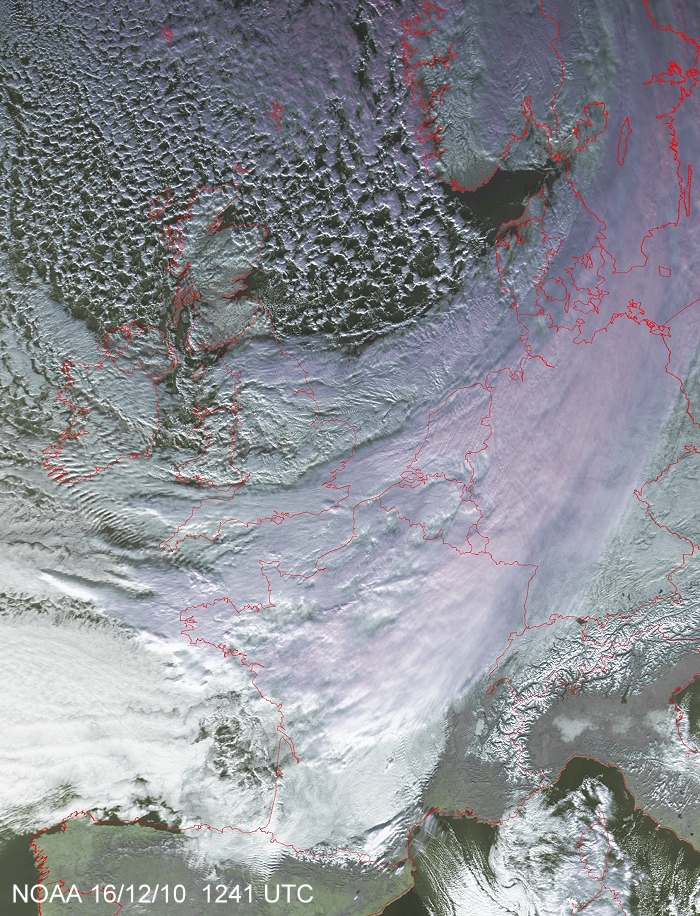
16/12/2010 1341 CET. Satellite in the visual channel.
Massive cloudiness related to the warm and cold front crossing the Low
Countries with behind the convective cells. (Source satpicture: NOAA
and University of Bern)
|
Radar loop (reflectivity in dBZ) between December 16 1600 CET and December 17 1200 CET. Intensive precipitation of warm and cold front, with along cold front also a brighter stripe (passing EBBR at 1710 UTC (or 1810 CET)). Later in the night a line of snow showers came in. (Source radar picture: Belgocontrol).
|
 |
|
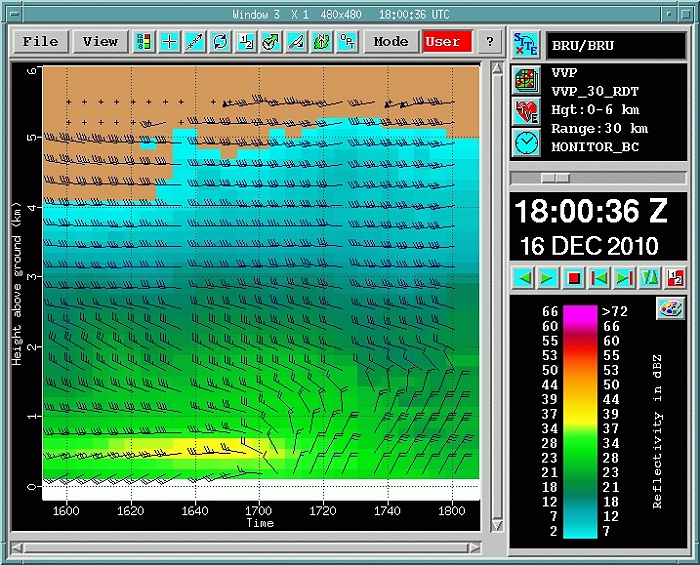
16/12/2010. Corresponding radar wind profiler at Brussels Airport
between 1600-1800 UTC giving clear evidence of a sharp directional shear
in the lowest 1,5 km on passage cold front which happened at Brussels
Airport around 1710 UTC. Legend: vertical axis height in km, horizontal
axis time step each 20 minute with the oldest data on the left hand side
(Source radar picture: Belgocontrol).
|
Some metars (hours in UTC) of Brussels Airport (EBBR). Translation: copy paste each obs via
metar-decoder
Between 1650-1720 UTC frontal passage, a closer investigation below via
screenshots of some meteo sensors at Brussels Airport. |
 |
|
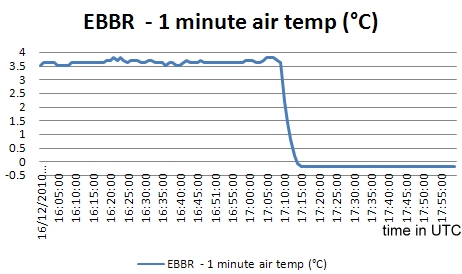
16/12/2010. Evolution of air temperature at Brussels Airport: at 1709UTC
still +3,6°C, afterwards rapidly dropping and holding at -0,2°C at 1714UTC.
|
 |
|
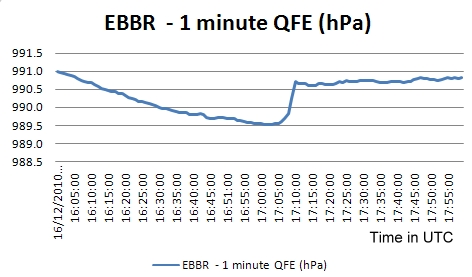
16/12/2010. Evolution of the pressure at the barometer level of Brussels
Airport (add 6,7 hPa for reducing to sea level). A strong pressure rise does occur at 1709-1710 UTC which should correspond with passage of cold front.
|
 |
|
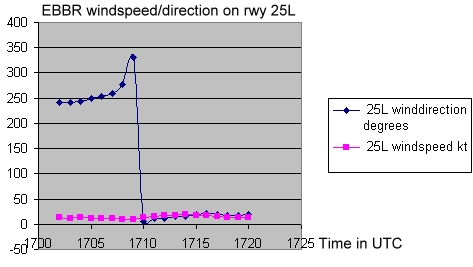
16/12/2010. Evolution of wind direction / speed at the end of runway 25L
at Brussels Airport. Between 1708-1710UTC a strong wind shift from 280 to 010 degrees, another clue for frontal passage.
|
 |
|
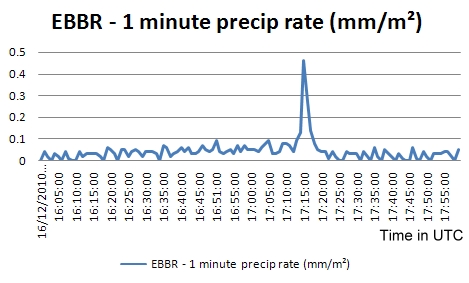
16/12/2010. Evolution of precipitation rate at Brussels Airport: at 1715 UTC
a peak did occur of 0,46 mm/minute (= 27,6 mm/h). Before that, a couple minutes of ice rain did fall and probable this package melted at once.
|
 |
|
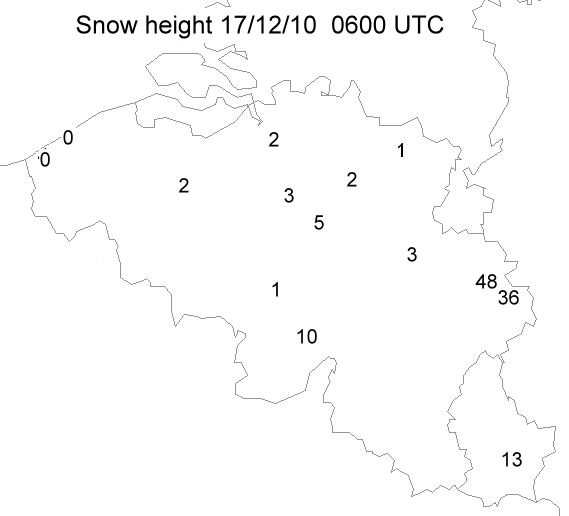
17/12/2010. Snow height in cm taken from the synops of 0600 UTC.
|
 |
|
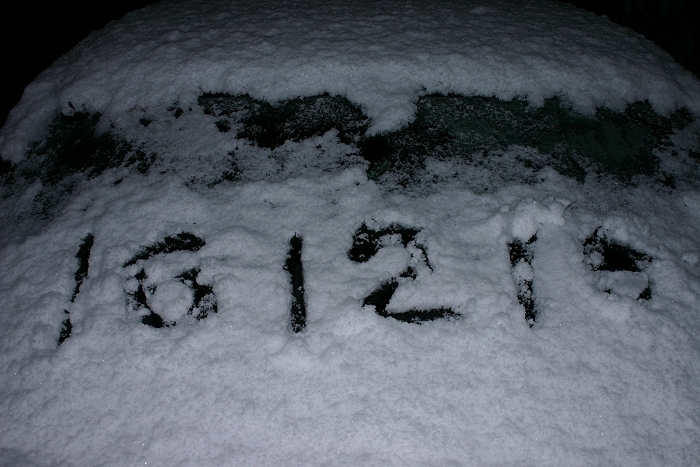
16/12/2010 2220. Proof of the date. The backside of cold front gave at
my location 2 cm, next morning the showers added 1 cm.
|
 |
|
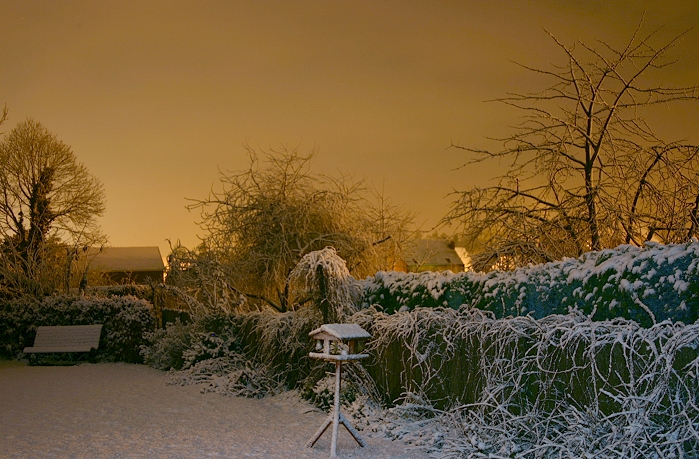
16/12/2010 2242. View of a garden.
|
 |
|
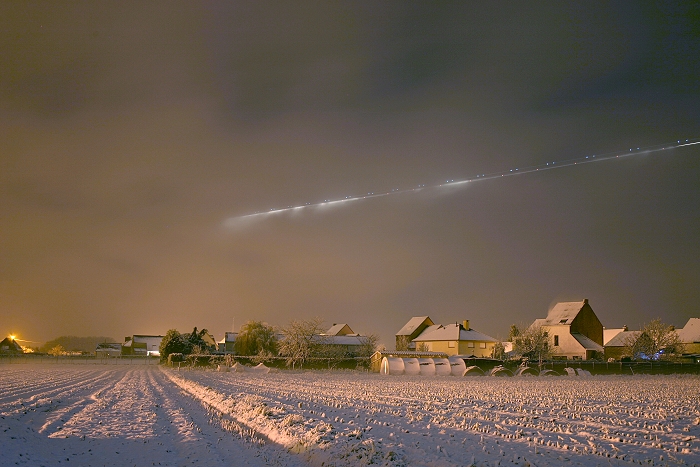
16/12/2010 2242 E. View of a field with in the sky the anti collision
lights of an incoming airplane for Brussels Airport.
|
 |
|
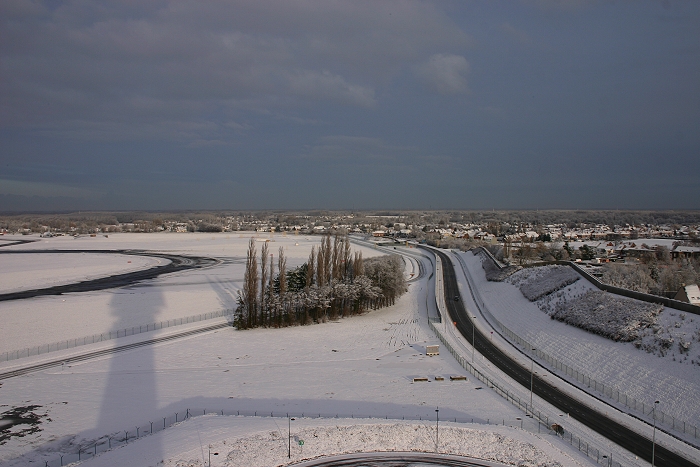
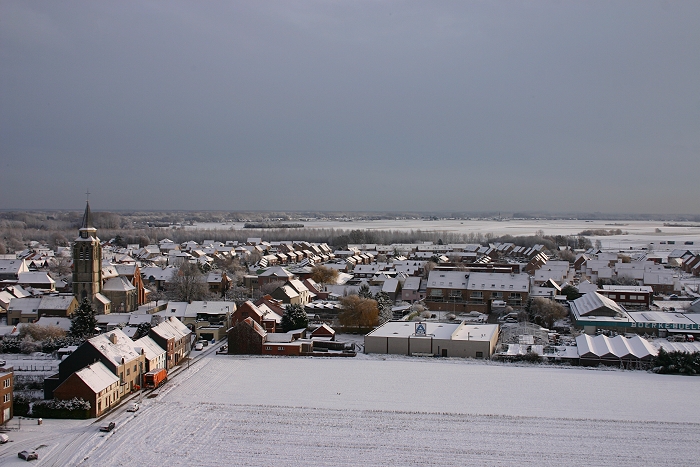
17/12/2010 1014 NNW. Next day, view towards Mechelen from the control
tower at Brussels Airport.
|
 |
|
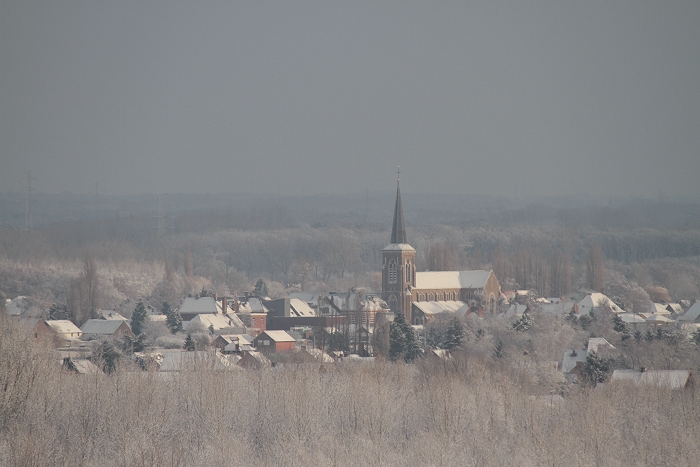
17/12/2010 1015 E. View towards village of Steenokkerzeel.
|
 |
|
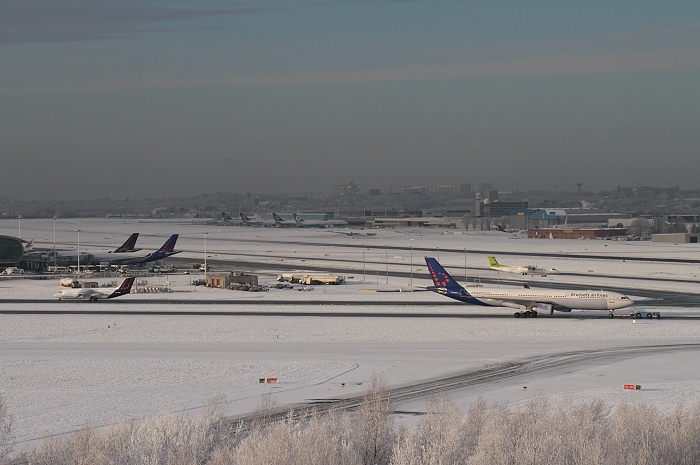
17/12/2010 1016 W. View towards Brussels Airport.
|
 |
|
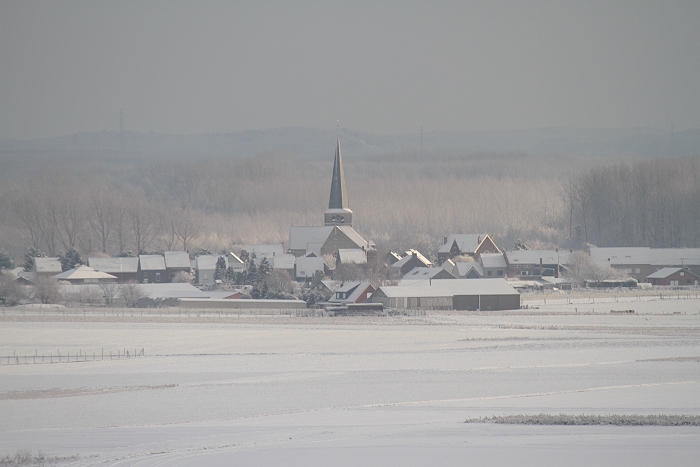
17/12/2010 1019 NE. View towards Kampenhout.
|
 |
|
17/12/2010 1021 E. View towards Nederokkerzeel.
|
 |
|
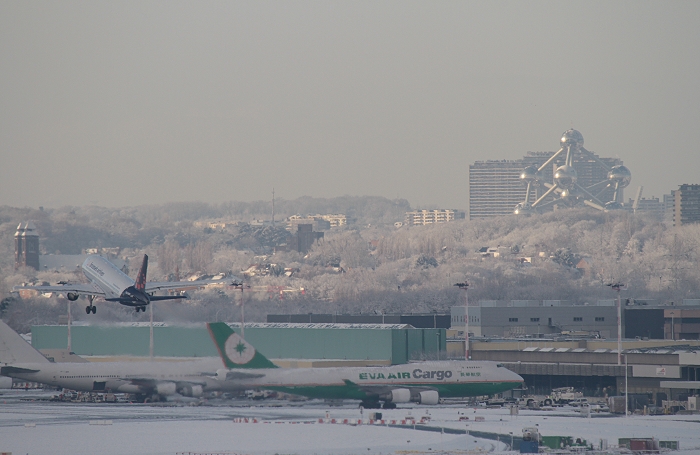
17/12/2010 1218 W. View towards Brussels City with Brucargo in
foreground.
|