| Weather pictures & report of January 30 2010 |
| Snow showers related to trough line. |
| Synopsis: at 500 hPa, related to a cut-off low near Scandinavia, a short wave trough crossed Belgium in the morning resulting in snow showers producing a deposit of 1 to 5 cm. All pictures were taken at Kampenhout (central Belgium), hours in local time (CET). |
 |
|||||||||||||||||||||||||||||||||||||||||||||||||||||||
|
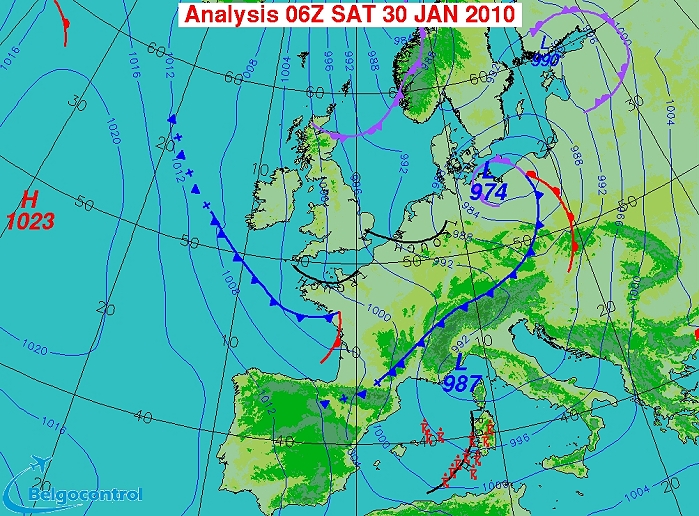
Surface analysis of January 30 2010 at 0700 CET. In a N'ly airflow a
trough line crossed Belgium during the morning. (Source chart: Belgocontrol)
|
|||||||||||||||||||||||||||||||||||||||||||||||||||||||
|
Loop of 6 surface analyses (of 06, 07, 08, 09, 10 and 11 CET) with
weather plots. (Source: meteocentre.com)
|
|||||||||||||||||||||||||||||||||||||||||||||||||||||||
 |
|||||||||||||||||||||||||||||||||||||||||||||||||||||||
|
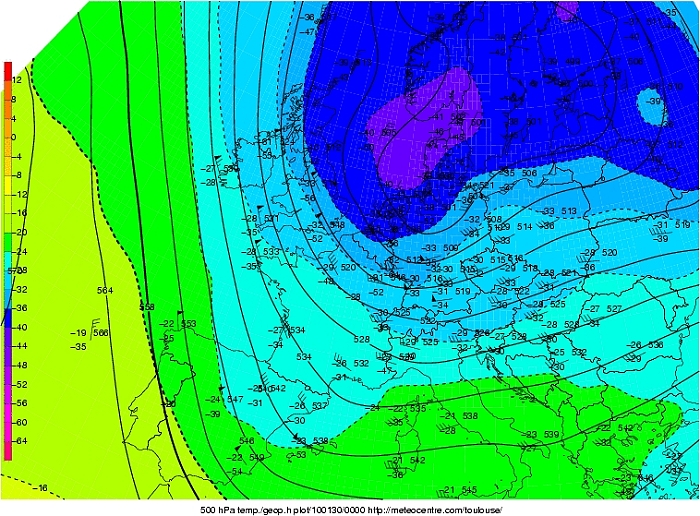
Upper air analysis 500 hPa of January 30 2010 at 0100 CET. Stationary cut-off
low near Scandinavia
in which a short wave structure crosses the Low Countries.
(Source chart: meteocentre.com)
|
|||||||||||||||||||||||||||||||||||||||||||||||||||||||
 |
|||||||||||||||||||||||||||||||||||||||||||||||||||||||
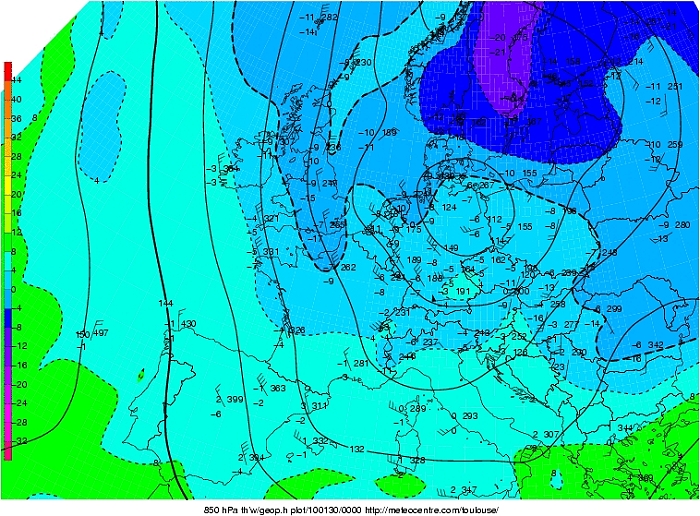
Upper air analysis 850 hPa of January 30 2010 at 0100 CET. Depicted
besides the geopotential height lines, are temperatures (in the plots)
and wet bulb potential temperatures (Tw) as colored zone. Latter is one
of the best indicators to have a clue about the form of precipitation
(solid or liquid), see table below.
(Source chart: meteocentre.com)
|
|||||||||||||||||||||||||||||||||||||||||||||||||||||||
|
Loop of forecasted soundings for a 36 hours period (in steps of three
hours) of Brussels for January 29 2010, 1900 CET onwards. Read off are
an unstable and during the night also saturated air column. Just in the
lowest level temperature is around 0°C, rest all negative. (Source: weatheronline.co.uk)
|
|||||||||||||||||||||||||||||||||||||||||||||||||||||||
|
30/01/2010 0500-0815 CET. Satellite loop in the infra-red channel
showing the small, but bright, scattered cloud canopy moving S-wards
over Belgium. (Source sat
picture: Eumetsat via Sat24.com)
|
|||||||||||||||||||||||||||||||||||||||||||||||||||||||
|
30/01/2010 0900-1545 CET. Satellite loop in the visible channel showing
initially the mostly cumuliform cloudiness over Belgium and a first
glimpse on the snow deposit. (Source sat
picture: Eumetsat via Sat24.com)
|
|||||||||||||||||||||||||||||||||||||||||||||||||||||||
Radar loop (rainfall rate in mm/hr) of January 30 2010 between 0350-1130 CET. The scattered but locally quite intense precipitation belt moved SE-wards, producing 1 to 5 cm of fresh snow in most parts of Belgium. (Source radar picture: Belgocontrol)
|
|||||||||||||||||||||||||||||||||||||||||||||||||||||||
Some metars (hours in UTC) of Brussels Airport (EBBR). Translation: copy
paste each obs via
metar-decoder | |||||||||||||||||||||||||||||||||||||||||||||||||||||||
|
Time lapse of webcam images between 0800-1607 CET. Most of the 5 cm snow
had already fallen before sunrise. Around 1010 a light snow shower
passed by, furthermore mostly sunny conditions in which during the
afternoon some light thaw did occur.
|
|||||||||||||||||||||||||||||||||||||||||||||||||||||||
 |
|||||||||||||||||||||||||||||||||||||||||||||||||||||||
|
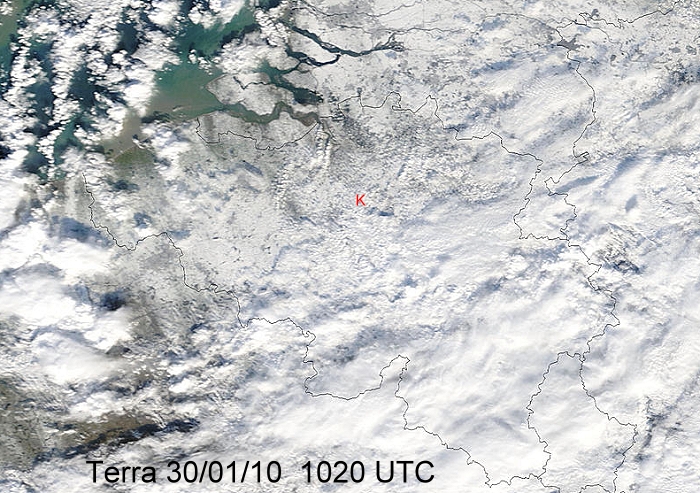
Remote sense satellite Terra with a view in the visible channel on the
snow in
Belgium. Especially over the Ardennes a lot of cloudiness is present. Clear
indication that western parts of West-Flanders had hardly a snow cover, this due to the
smaller amounts of precipitation and also slightly milder air due to the
rather strong winds blowing from the Northsea. Pics below were taken
from location red "K". (Source: Image courtesy of MODIS Rapid
Response Project at NASA/GSFC)
|
|||||||||||||||||||||||||||||||||||||||||||||||||||||||
 |
|||||||||||||||||||||||||||||||||||||||||||||||||||||||
|
Maximal snow heights (in cm) of some official stations taken from synops of
different hours.
|
|||||||||||||||||||||||||||||||||||||||||||||||||||||||
 |
|||||||||||||||||||||||||||||||||||||||||||||||||||||||
|
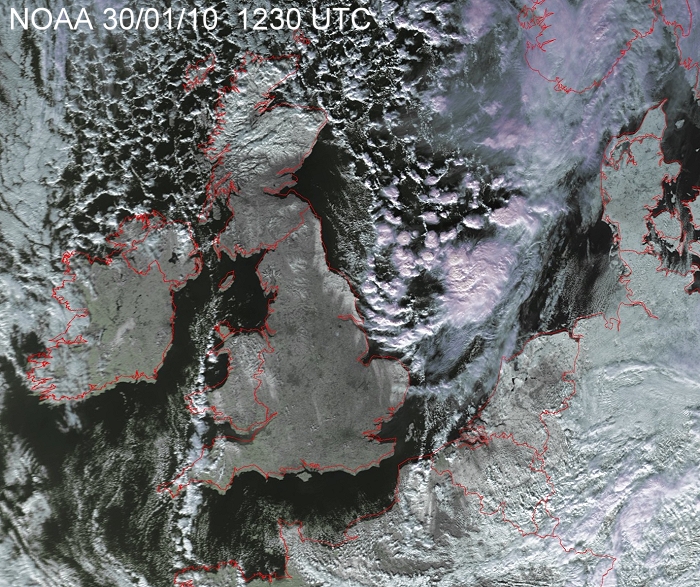
Satellite picture in the visible channel over northwest Europe. Northern
& eastern parts of the U.K had a snow cover, just like large parts of
the continent. Over the Northsea another intense showery cluster which
moved southwards and affected late evening Belgium, but its activity was
by then much reduced. (Source: NOAA & University of Bern)
|
|||||||||||||||||||||||||||||||||||||||||||||||||||||||
 |
|||||||||||||||||||||||||||||||||||||||||||||||||||||||
|
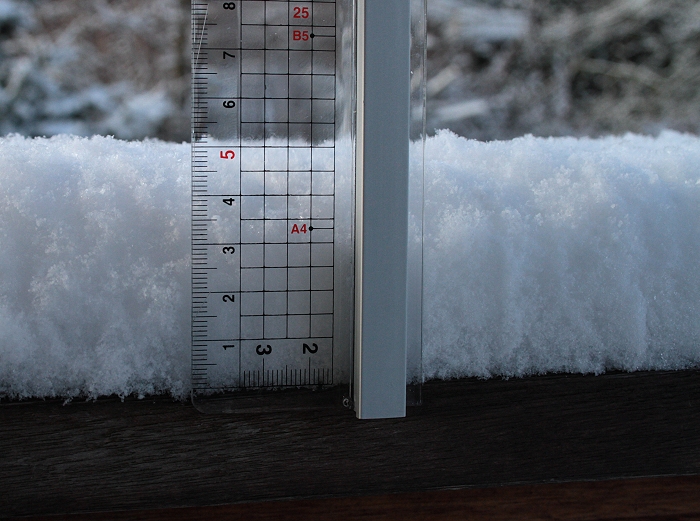
30/01/2010. Proof of 5 cm of snow.
|
|||||||||||||||||||||||||||||||||||||||||||||||||||||||
 |
|||||||||||||||||||||||||||||||||||||||||||||||||||||||
|
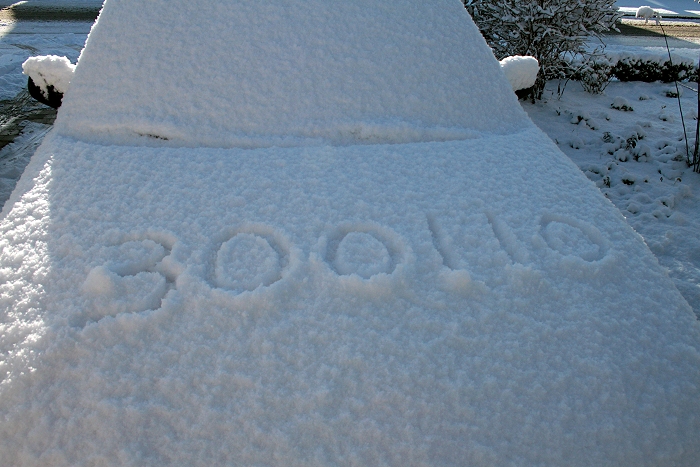
30/01/2010. Proof of the date.
|
|||||||||||||||||||||||||||||||||||||||||||||||||||||||
 |
|||||||||||||||||||||||||||||||||||||||||||||||||||||||
|
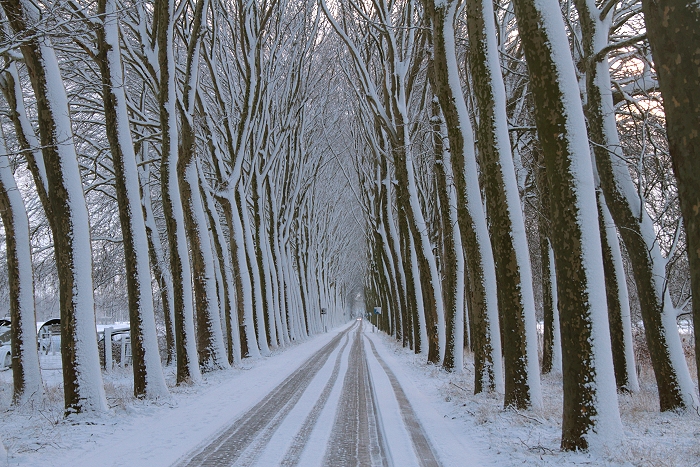
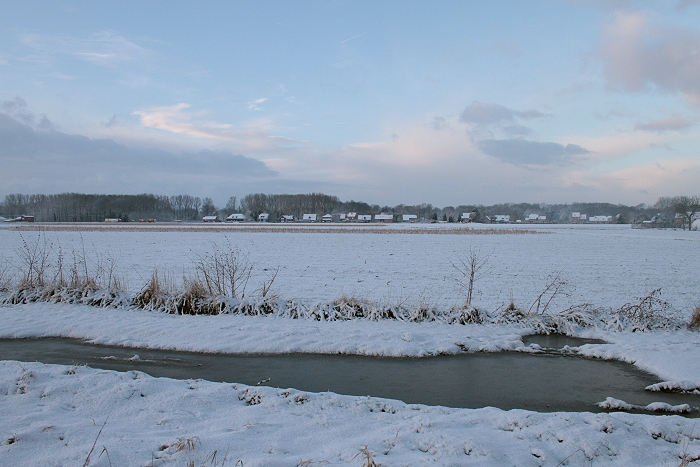
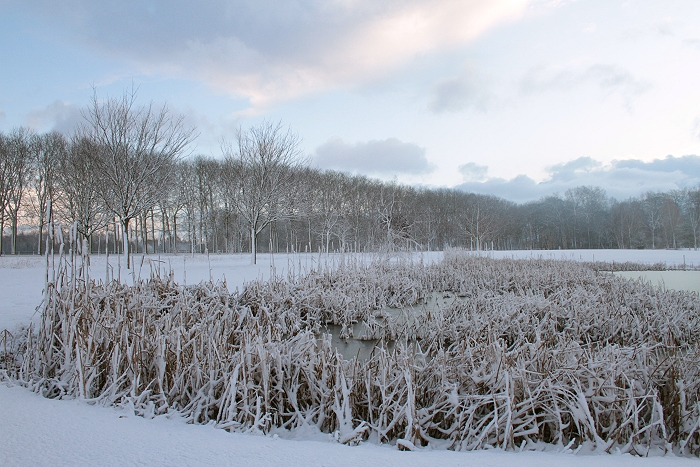
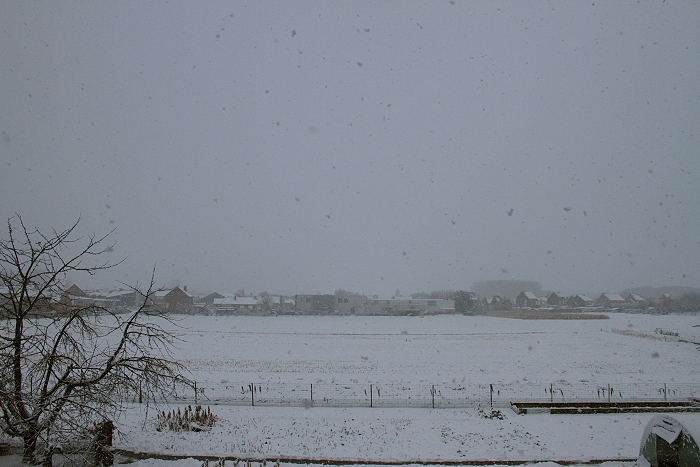
30/01/2010 0858 ESE. Always a pleasure to see this wintry view.
|
|||||||||||||||||||||||||||||||||||||||||||||||||||||||
 |
|||||||||||||||||||||||||||||||||||||||||||||||||||||||
|
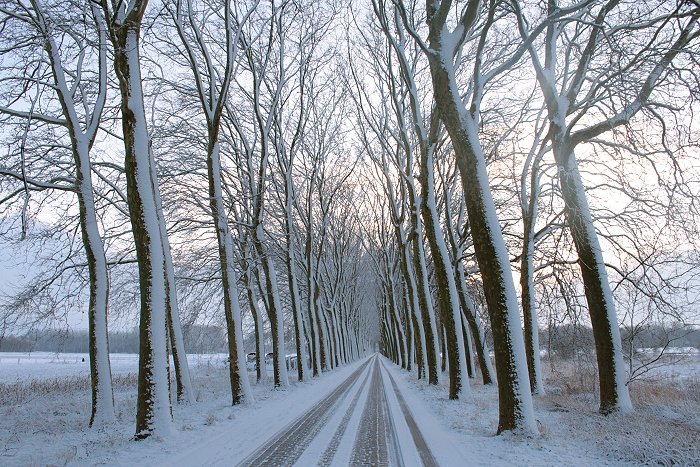
30/01/2010 0859 ESE.
|
|||||||||||||||||||||||||||||||||||||||||||||||||||||||
 |
|||||||||||||||||||||||||||||||||||||||||||||||||||||||
|
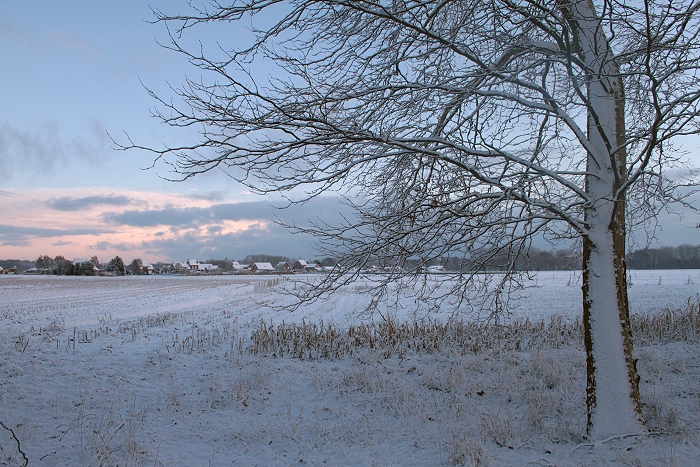
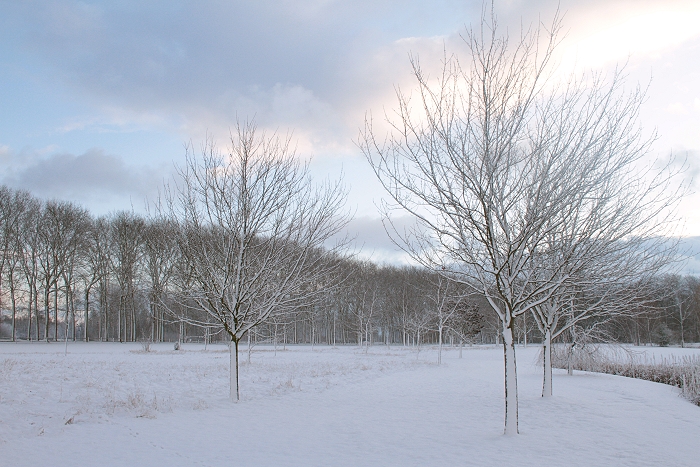
30/01/2010 0900 N.
|
|||||||||||||||||||||||||||||||||||||||||||||||||||||||
 |
|||||||||||||||||||||||||||||||||||||||||||||||||||||||
|
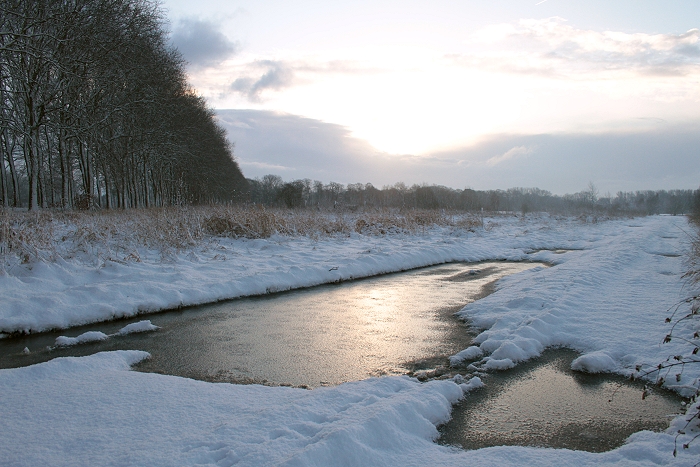
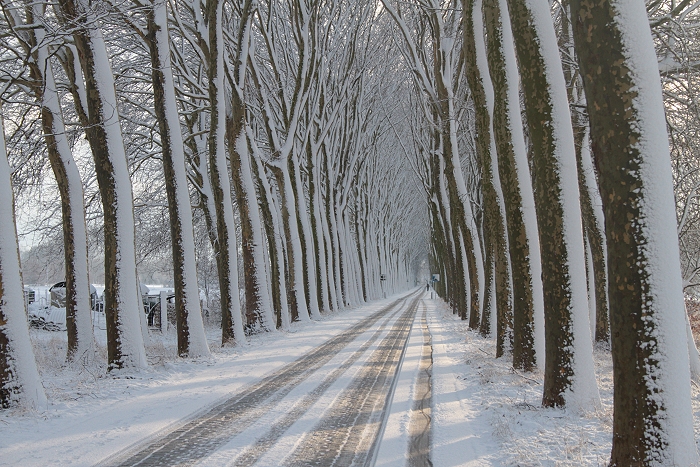
30/01/2010 0904 ESE. The sun still behind clouds.
|
|||||||||||||||||||||||||||||||||||||||||||||||||||||||
 |
|||||||||||||||||||||||||||||||||||||||||||||||||||||||
|
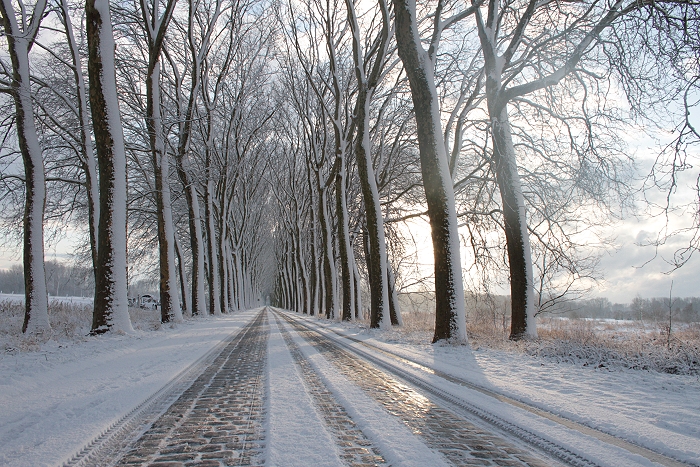
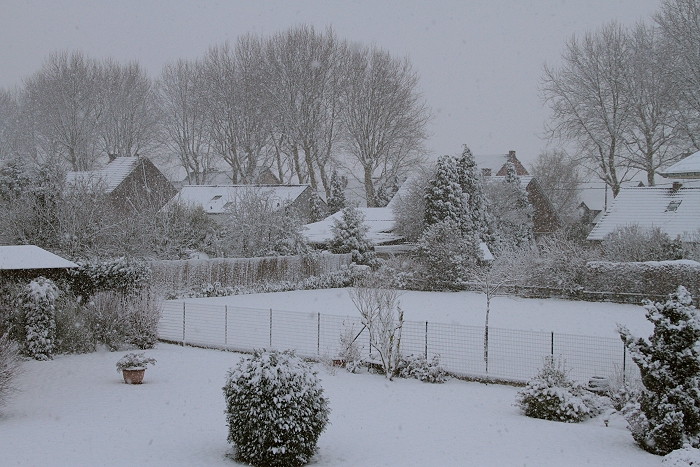
30/01/2010 0905 SW.
|
|||||||||||||||||||||||||||||||||||||||||||||||||||||||
 |
|||||||||||||||||||||||||||||||||||||||||||||||||||||||
|
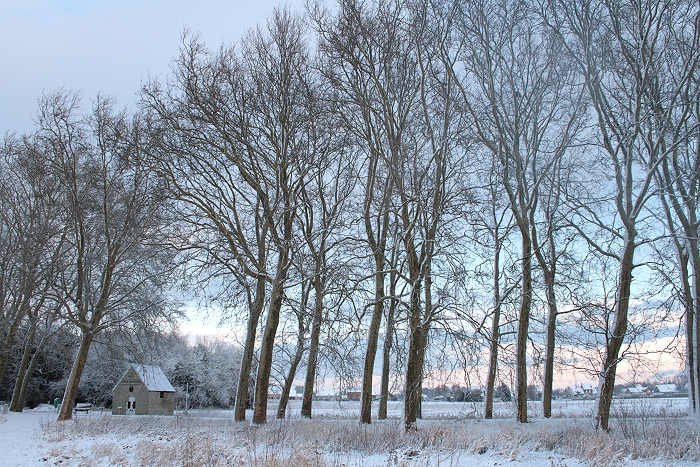
30/01/2010 0906 NW. Some postcard views from Kampenhout.
|
|||||||||||||||||||||||||||||||||||||||||||||||||||||||
 |
|||||||||||||||||||||||||||||||||||||||||||||||||||||||
|
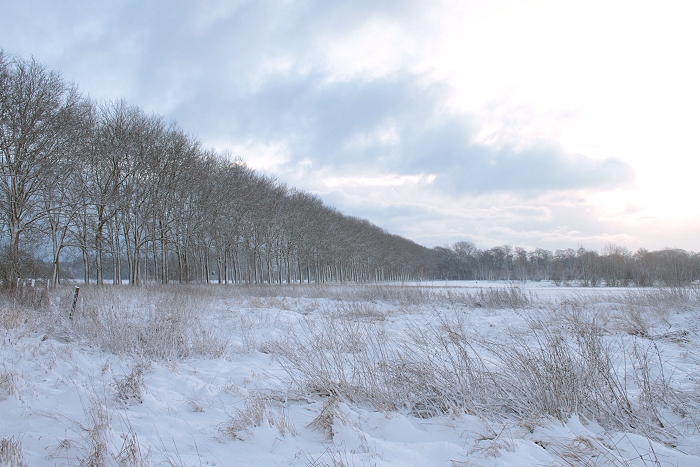
30/01/2010 0907 ESE. Some damp on the field.
|
|||||||||||||||||||||||||||||||||||||||||||||||||||||||
 |
|||||||||||||||||||||||||||||||||||||||||||||||||||||||
|
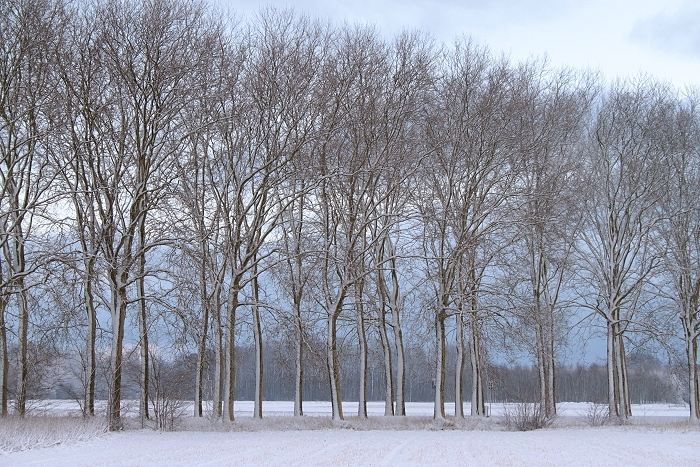
30/01/2010 0908 NE.
|
|||||||||||||||||||||||||||||||||||||||||||||||||||||||
 |
|||||||||||||||||||||||||||||||||||||||||||||||||||||||
|
30/01/2010 0917 NE.
|
|||||||||||||||||||||||||||||||||||||||||||||||||||||||
 |
|||||||||||||||||||||||||||||||||||||||||||||||||||||||
|
30/01/2010 0918 NE.
|
|||||||||||||||||||||||||||||||||||||||||||||||||||||||
 |
|||||||||||||||||||||||||||||||||||||||||||||||||||||||
|
30/01/2010 0928 ESE. Bit later, the sun came out.
|
|||||||||||||||||||||||||||||||||||||||||||||||||||||||
 |
|||||||||||||||||||||||||||||||||||||||||||||||||||||||
|
30/01/2010 0930 ESE.
|
|||||||||||||||||||||||||||||||||||||||||||||||||||||||
 |
|||||||||||||||||||||||||||||||||||||||||||||||||||||||
|
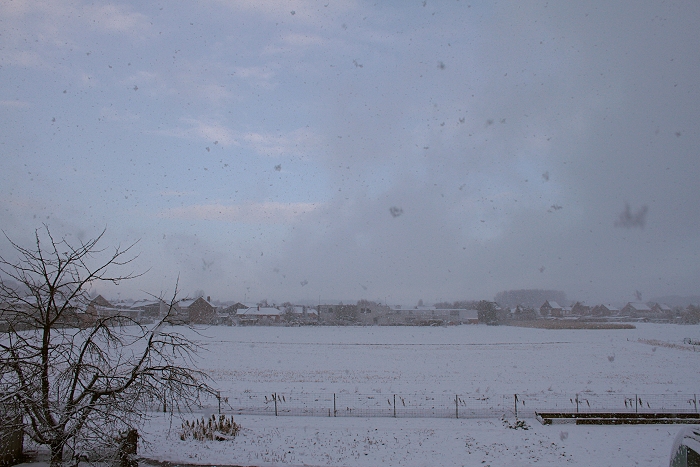
30/01/2010 1007 N. Passage of a final snow shower.
|
|||||||||||||||||||||||||||||||||||||||||||||||||||||||
 |
|||||||||||||||||||||||||||||||||||||||||||||||||||||||
|
30/01/2010 1008 S. Opposite view.
|
|||||||||||||||||||||||||||||||||||||||||||||||||||||||
 |
|||||||||||||||||||||||||||||||||||||||||||||||||||||||
|
30/01/2010 1012 N. Snow shower easing off.
|